 |
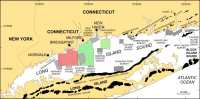
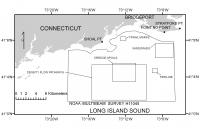
Figure 1. study location map - Map showing location of the Bridgeport, Connecticut, study area (red polygon). Also shown are the sites of major onshore and offshore moraines and other interpreted sidescan-sonar surveys in Long Island Sound: NOAA Survey H11044 -- McMullen and others (2005); NOAA Survey H11043 -- Poppe and others (2004);Norwalk -- Twichell and others (1997); Milford -- Twichell and others (1998); New Haven Harbor and CLIS -- Poppe and others (2001); Roanoke Point -- Poppe and others (1999a); Falkner Island -- Poppe and others (1999b); Hammonasset -- Poppe and others (1997); Niantic Bay -- Poppe and others (1998a); New London -- Poppe and others (1992), Moffett and others (1994), Zajac and others (2000, 2003); Fishers Island Sound -- Poppe and others (1998b). |
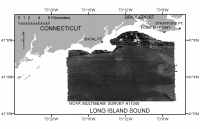 | Figure 2. h11045 mosaic - Sidescan-sonar mosaic of the sea floor off Bridgeport, Connecticut, (NOAA survey H11045). Light tones on the image represent areas of relatively high backscatter (typically coarser grained sediments); dark tones represent areas of relatively low backscatter (typically finer grained sediments). Appearance of parallel lineation in parts of the mosaic is caused by poor tone matching of ships track lines. |
 | Figure 3. towfish - KLEIN 5500 Sidescan-Sonar Towfish used aboard the NOAA ship RUDE for data acquisition during NOAA survey H11045. (Photo by Klein Associates, Inc.) |
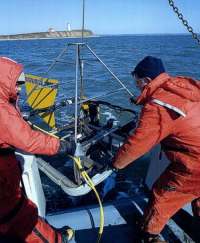 | Figure 4. sampling - Image shows USGS and Connecticut DEP scientists deploying a modified Van Veen grab sampler in Long Island Sound, off Falkner Island. This sampler is equipped with both still and video cameras (Poppe and others, 2004). |
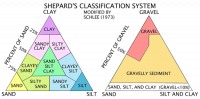 | Figure 5. sediment classification - Sediment classification scheme from Shepard (1954) as modified by Schlee (1973). |
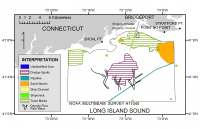 | Figure 6. interpretation - Interpretation of the sidescan-sonar mosaic (NOAA survey H11045) off Bridgeport, Connecticut. Features are discussed in the text. |
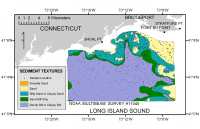 | Figure 7. texture - Distribution of surficial sediments off Bridgeport, Connecticut, based on sample data, on tonal changes in backscatter on the sidescan-sonar image, and on correlation of the textural and backscatter data with the bathymetry. |
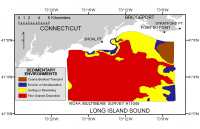 | Figure 8. sedimentary environment - Map showing the distribution of sea-floor sedimentary environments off Bridgeport, Connecticut. |
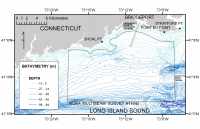 | Figure 9. bathymetry - Bathymetry of Bridgeport, Connecticut, study area, bathymetric contours from DiGiacomo-Cohn and others (1998). |
 | Figure 10. location - Map showing locations of the detailed views of the sidescan-sonar images (figs. 11-14 and fig. 20). |
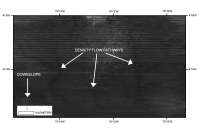 | Figure 11. density flow pathways - Sidescan-sonar view of density flow pathways within the Bridgeport, Connecticut, study area. Location of this view is shown in Fig. 10. |
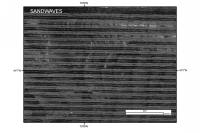 | Figure 12. sandwaves - Detailed view of sand waves in the Bridgeport, Connecticut, study area. Location shown in fig. 10. |
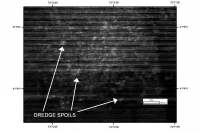 | Figure 13. dredge spoils - Detailed view of dredge-spoil mounds in the sidescan-sonar mosaic from the Bridgeport, Connecticut, study area. Location of this view is shown in fig. 10. |
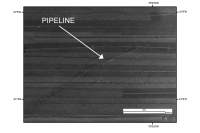 | Figure 14. pipeline - Detailed view of pipeline in the sidescan-sonar mosaic from the Bridgeport, Connecticut, study area. Location of this view is shown in fig 10. |
 | Figure 15. fishing a - Clam trawler at sea in north-central Long Island Sound. |
 | Figure 16. fishing b - Lobster boat pulling traps in Long Island Sound. |
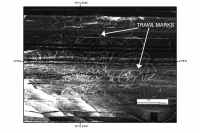 | Figure 17. trawlmarks - Detailed view of trawl marks in the sidescan-sonar mosaic from the Bridgeport, Connecticut, study area. Looped curvilinear trawl marks result from commercial hard-shell clam fishing. Location of this view is shown in fig 10. |
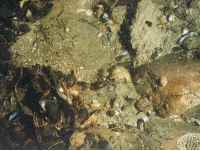 | Figure 18. erosion - Bottom photograph showing an example of a sedimentary environment characterized by erosion or nondeposition. Note the gravelly sediment and sessile fauna. Bottom photo is from Niantic Bay in Long Island Sound (Poppe and others, 2000c). |
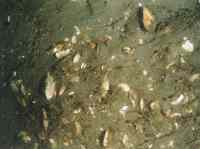 | Figure 19. sorting/reworking - Bottom photograph showing an example of a sedimentary environment characterized by sorting or reworking. Note the sandy muddy sediment and abundant shell debris. Bottom photo is from Niantic Bay in Long Island Sound (Poppe and others, 2000c). |
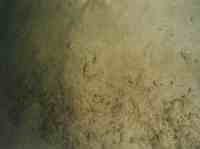 | Figure 20. deposition - Bottom photograph showing an example of a sedimentary environment characterized by deposition. Note the muddy sediment and abundant polychaete and amphipod tubes. Bottom photo is from Niantic Bay in Long Island Sound (Poppe and others, 2000c).
|