
The Digital Shoreline Analysis System (DSAS) version 6 is a standalone application that calculates shoreline or boundary change over time. The GIS of a user’s choice is used to prepare the data for DSAS. Like previous versions, DSAS v.6 enables a user to calculate rate-of-change statistics from multiple historical shoreline positions.
Digital Shoreline Analysis System (DSAS) Active
By Woods Hole Coastal and Marine Science Center
December 6, 2022
Software for calculating positional boundary change over time
The Digital Shoreline Analysis System (DSAS) version 6 is a standalone application that calculates shoreline or boundary change over time. The GIS of a user’s choice is used to prepare the data for DSAS. Like previous versions, DSAS v.6 enables a user to calculate rate-of-change statistics from multiple historical shoreline positions. It provides an automated method for establishing measurement transects, performs rate calculations, and provides uncertainties associated with rates of change. A user-friendly interface allows the user to complete the workflow for shoreline change analysis.
Suggested citation:
Himmelstoss, E.A., Henderson, R.E., Farris, A.S., Kratzmann, M.G., Bartlett, M.K., Ergul, A., McAndrews, J., Cibaj, R., Zichichi, J.L., and Thieler, E.R., 2024, Digital Shoreline Analysis System version 6.0: U.S. Geological Survey software release, https://doi.org/10.5066/P13WIZ8M.
DSAS Software
DSAS Software

DSAS software is used to calculate shoreline or boundary change over time. To download the free standalone software, click below:
Sample Data
Sample Data

Load sample data to explore DSAS version 6.0. To download free sample data, click below:
The existing user guide originally written for DSAS v.5.1 is available and applicable to many aspects of DSAS v.6.0. The user guide has relevant information providing instruction on the DSAS workflow including how to define a reference baseline for measurements, attribute requirements for baselines and shorelines, and supporting information on rate calculations and statistics.
For additional questions please contact DSAS_help@usgs.gov
PLEASE NOTE: The USGS End of Life (EOL) date for ArcMap was February 1, 2024, as there will no longer be software updates and patches released from Esri. ArcMap’s EOL is the primary reason we have developed DSAS v.6.0 as standalone software that will work with any GIS. Due to the timeline constraints, this first-released software version was developed with minimal functionality in mind in order to meet essential user needs. In later development phases, we plan to reinstate capability from v.5 and explore more enhancements. Thank you for understanding!
Current Version
DSAS version 6.0 was released in April 2024 and is publicly available here.
Baseline and shoreline data are prepared in a GIS and converted to .geojson format prior to upload in DSAS. DSAS uses and outputs GeoJSON files which include geospatial and tabular data. Some GIS programs, such as QGIS, can view and edit GeoJSON files directly, and some, like ArcPro require a conversion before they can be viewed. Editing must be done in GIS software.
In version 6.0, only onshore or offshore baselines will be accepted for rate calculation.

Sources/Usage: Public Domain. View Media Details
Introduction
Sources/Usage: Public Domain. View Media Details
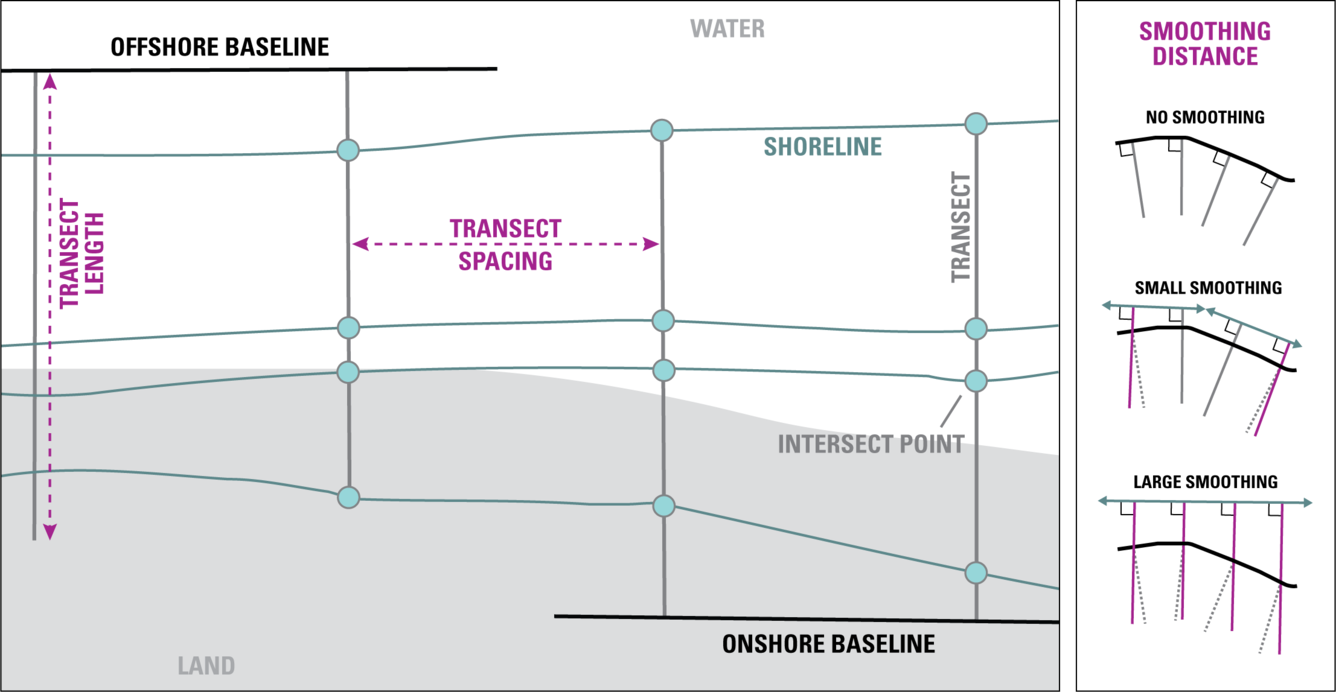
DSAS generates transects that are cast perpendicular to the reference baseline to intersect shorelines at a user-specified spacing alongshore. Please note that the figure above illustrates the placement of both onshore and offshore baselines as examples. In DSAS v6.0 all baselines in a file must be placed either offshore or onshore, not combined.
DSAS measures the distance between the baseline and each shoreline intersection along a transect, and combines date information, and positional uncertainty for each shoreline, to generate the following change metrics (see DSAS v.5.1 user guide for more detail):
Distance measurements:
- Shoreline Change Envelope (SCE)
- Net Shoreline Movement (NSM)
Statistics:
- End Point Rate (EPR)
- Uncertainty of the End Point Rate (EPRunc)
- Linear Regression Rate (LRR)
- Confidence Interval (LCI)
- Standard Error (LSE)
- R-squared (LR2)
- Weighted Linear Regression Rate (WLR)
- Confidence Interval (WCI)
- Standard Error (WSE)
- R-squared (WR2)
The results of all calculations are output to a rates file (.geojson) accompanied by an intersects file (.geojson) and associated metadata (.xml). Users also have the option to generate a summary report (.txt).
History
DSAS has been a central component of the U.S. Geological Survey’s Coastal Change Hazards programmatic focus, providing a robust suite of regression rates in a standardized and easily repeatable method that can be executed on large volumes of data collected at a national scale. The DSAS software is intended to facilitate the shoreline change-calculation process and to provide rate-of-change information and the statistical data necessary to establish the reliability of the calculated results.
The software is also suitable for any application that calculates positional change over time, such as assessing change of glacier limits in sequential aerial photos, river edge boundaries, or land-cover changes. National and state governments worldwide have used the tool in support of resource management and critical coastal decision-making.
The DSAS software was originally developed in the early 1990s and has undergone continuous refinement since that time.
- DSAS version 1.0 (1992) was written in the C and awk programming languages for use with the MapGrafix and ArcInfo Geographic Information Systems
- DSAS version 2.0 was written in Avenue for ArcView 3.x
- DSAS version 3.x (ArcGIS 9)
- DSAS version 4.2 (ArcGIS 9.2-9.3.x)
- DSAS version 4.3 (ArcGIS 10.0-10.3)
- DSAS version 4.4 (ArcGIS 10.4 -10.5)
- DSAS version 5.0 - 5.1 (ArcGIS 10.4 - 10.x)
Current version, 6.0, is a standalone application to be used in conjunction with a GIS
Below are multimedia items associated with this project.

DSAS v6.0 Infographic
The Digital Shoreline Analysis System (DSAS) version 6 is a standalone application that calculates shoreline or boundary change over time. The GIS of a user’s choice is used to prepare the data for DSAS. Like previous versions, DSAS v.6 enables a user to calculate rate-of-change statistics from multiple historical shoreline positions.

DSAS
DSAS generates transects that are cast perpendicular to the reference baseline to intersect shorelines at a user-specified spacing alongshore. Please note that the figure above illustrates the placement of both onshore and offshore baselines as examples. In DSAS v6.0 all baselines in a file must be placed either offshore or onshore, not combined.
DSAS generates transects that are cast perpendicular to the reference baseline to intersect shorelines at a user-specified spacing alongshore. Please note that the figure above illustrates the placement of both onshore and offshore baselines as examples. In DSAS v6.0 all baselines in a file must be placed either offshore or onshore, not combined.

DSAS v6.0 Interface
The Digital Shoreline Analysis System (DSAS) version 6 is a standalone application that calculates shoreline or boundary change over time. The GIS of a user’s choice is used to prepare the data for DSAS. Like previous versions, DSAS v.6 enables a user to calculate rate-of-change statistics from multiple historical shoreline positions.
The Digital Shoreline Analysis System (DSAS) version 6 is a standalone application that calculates shoreline or boundary change over time. The GIS of a user’s choice is used to prepare the data for DSAS. Like previous versions, DSAS v.6 enables a user to calculate rate-of-change statistics from multiple historical shoreline positions.
- Overview
Software for calculating positional boundary change over time
The Digital Shoreline Analysis System (DSAS) version 6 is a standalone application that calculates shoreline or boundary change over time. The GIS of a user’s choice is used to prepare the data for DSAS. Like previous versions, DSAS v.6 enables a user to calculate rate-of-change statistics from multiple historical shoreline positions. It provides an automated method for establishing measurement transects, performs rate calculations, and provides uncertainties associated with rates of change. A user-friendly interface allows the user to complete the workflow for shoreline change analysis.
Suggested citation:
Himmelstoss, E.A., Henderson, R.E., Farris, A.S., Kratzmann, M.G., Bartlett, M.K., Ergul, A., McAndrews, J., Cibaj, R., Zichichi, J.L., and Thieler, E.R., 2024, Digital Shoreline Analysis System version 6.0: U.S. Geological Survey software release, https://doi.org/10.5066/P13WIZ8M.
DSAS Software
DSAS software is used to calculate shoreline or boundary change over time. To download the free standalone software, click below:
Sample Data
Load sample data to explore DSAS version 6.0. To download free sample data, click below:
The existing user guide originally written for DSAS v.5.1 is available and applicable to many aspects of DSAS v.6.0. The user guide has relevant information providing instruction on the DSAS workflow including how to define a reference baseline for measurements, attribute requirements for baselines and shorelines, and supporting information on rate calculations and statistics.
For additional questions please contact DSAS_help@usgs.gov
PLEASE NOTE: The USGS End of Life (EOL) date for ArcMap was February 1, 2024, as there will no longer be software updates and patches released from Esri. ArcMap’s EOL is the primary reason we have developed DSAS v.6.0 as standalone software that will work with any GIS. Due to the timeline constraints, this first-released software version was developed with minimal functionality in mind in order to meet essential user needs. In later development phases, we plan to reinstate capability from v.5 and explore more enhancements. Thank you for understanding!
Current Version
DSAS version 6.0 was released in April 2024 and is publicly available here.
Baseline and shoreline data are prepared in a GIS and converted to .geojson format prior to upload in DSAS. DSAS uses and outputs GeoJSON files which include geospatial and tabular data. Some GIS programs, such as QGIS, can view and edit GeoJSON files directly, and some, like ArcPro require a conversion before they can be viewed. Editing must be done in GIS software.
In version 6.0, only onshore or offshore baselines will be accepted for rate calculation.
Sources/Usage: Public Domain. View Media DetailsIntroduction
Sources/Usage: Public Domain. View Media DetailsDSAS generates transects that are cast perpendicular to the reference baseline to intersect shorelines at a user-specified spacing alongshore. Please note that the figure above illustrates the placement of both onshore and offshore baselines as examples. In DSAS v6.0 all baselines in a file must be placed either offshore or onshore, not combined.
DSAS measures the distance between the baseline and each shoreline intersection along a transect, and combines date information, and positional uncertainty for each shoreline, to generate the following change metrics (see DSAS v.5.1 user guide for more detail):
Distance measurements:
- Shoreline Change Envelope (SCE)
- Net Shoreline Movement (NSM)
Statistics:
- End Point Rate (EPR)
- Uncertainty of the End Point Rate (EPRunc)
- Linear Regression Rate (LRR)
- Confidence Interval (LCI)
- Standard Error (LSE)
- R-squared (LR2)
- Weighted Linear Regression Rate (WLR)
- Confidence Interval (WCI)
- Standard Error (WSE)
- R-squared (WR2)
The results of all calculations are output to a rates file (.geojson) accompanied by an intersects file (.geojson) and associated metadata (.xml). Users also have the option to generate a summary report (.txt).
History
DSAS has been a central component of the U.S. Geological Survey’s Coastal Change Hazards programmatic focus, providing a robust suite of regression rates in a standardized and easily repeatable method that can be executed on large volumes of data collected at a national scale. The DSAS software is intended to facilitate the shoreline change-calculation process and to provide rate-of-change information and the statistical data necessary to establish the reliability of the calculated results.
The software is also suitable for any application that calculates positional change over time, such as assessing change of glacier limits in sequential aerial photos, river edge boundaries, or land-cover changes. National and state governments worldwide have used the tool in support of resource management and critical coastal decision-making.
The DSAS software was originally developed in the early 1990s and has undergone continuous refinement since that time.
- DSAS version 1.0 (1992) was written in the C and awk programming languages for use with the MapGrafix and ArcInfo Geographic Information Systems
- DSAS version 2.0 was written in Avenue for ArcView 3.x
- DSAS version 3.x (ArcGIS 9)
- DSAS version 4.2 (ArcGIS 9.2-9.3.x)
- DSAS version 4.3 (ArcGIS 10.0-10.3)
- DSAS version 4.4 (ArcGIS 10.4 -10.5)
- DSAS version 5.0 - 5.1 (ArcGIS 10.4 - 10.x)
Current version, 6.0, is a standalone application to be used in conjunction with a GIS
- Data
- Multimedia
Below are multimedia items associated with this project.
DSAS v6.0 InfographicThe Digital Shoreline Analysis System (DSAS) version 6 is a standalone application that calculates shoreline or boundary change over time. The GIS of a user’s choice is used to prepare the data for DSAS. Like previous versions, DSAS v.6 enables a user to calculate rate-of-change statistics from multiple historical shoreline positions.
The Digital Shoreline Analysis System (DSAS) version 6 is a standalone application that calculates shoreline or boundary change over time. The GIS of a user’s choice is used to prepare the data for DSAS. Like previous versions, DSAS v.6 enables a user to calculate rate-of-change statistics from multiple historical shoreline positions.
DSASDSAS generates transects that are cast perpendicular to the reference baseline to intersect shorelines at a user-specified spacing alongshore. Please note that the figure above illustrates the placement of both onshore and offshore baselines as examples. In DSAS v6.0 all baselines in a file must be placed either offshore or onshore, not combined.
DSAS generates transects that are cast perpendicular to the reference baseline to intersect shorelines at a user-specified spacing alongshore. Please note that the figure above illustrates the placement of both onshore and offshore baselines as examples. In DSAS v6.0 all baselines in a file must be placed either offshore or onshore, not combined.
DSAS v6.0 InterfaceThe Digital Shoreline Analysis System (DSAS) version 6 is a standalone application that calculates shoreline or boundary change over time. The GIS of a user’s choice is used to prepare the data for DSAS. Like previous versions, DSAS v.6 enables a user to calculate rate-of-change statistics from multiple historical shoreline positions.
The Digital Shoreline Analysis System (DSAS) version 6 is a standalone application that calculates shoreline or boundary change over time. The GIS of a user’s choice is used to prepare the data for DSAS. Like previous versions, DSAS v.6 enables a user to calculate rate-of-change statistics from multiple historical shoreline positions.
- Publications
- Web Tools
- Software
- News