|
|
Description of Movie Frames
Each movie frame includes a photograph of the sea floor at the top of the frame and shows oceanographic data collected at the same time at the bottom of the frame. The movie plays at 3 frames/second (1.3 seconds/day for photographs obtained every 6 hours or 2 seconds/day for photographs obtained every 4 hours). The field of view of the photograph is approximately 1.5 m wide and 1 m high. The vane on the compass in the photographs swings with the current and points in the direction of current flow. The triangular black arrow on the compass points toward magnetic north (16 degrees west of true north at LT-A). The white arrow in the upper left of the frame points toward true north. The file name of the photograph is in the upper left corner of each frame. This number provides a key to the individual photograph; see Photographs in table 3. The red digits in the lower left corner of the photograph show time (in Eastern Standard Time): HR.MM (hour and minute) on the upper line and SS.DD (second and day) on the second line. The day (DD) counter rolls over every 31 days and thus does not indicate the true day of the month for the entire deployment; the correct day of the month is below the data panel (see below). The third line of larger red digits is a record identifier (N.N., the last two digits of the USGS mooring number).
Below the photograph to the right is a data panel that shows (1) a plot of current speed (in cm/s at 1 m above bottom (mab) (in red); (2) beam attenuation (in m-1), a measure of water clarity, at about 2 mab (in blue); (3) standard deviation of bottom pressure (PSDEV)( in mb), a measure of wave intensity, at about 2 mab (in black); and (4) water temperature (in degrees C) at about 2 mab (in green) obtained every 3.75 minutes. The data scales are the same for all movies and have been selected to show the data under most conditions. However, sometimes during large storms PSDEV and beam attenuation are offscale.The values of current speed, beam attenuation, standard deviation of pressure, and bottom temperature at the approximated time of the photograph (by evenly spacing the photographs over the deployment period) also are listed in the data panel. The vertical black line in the center of the data panel is the time of the photograph. The plot shows 4 days of data, 2 days before and 2 days after the photograph displayed was obtained. Below the photograph to the left is a vector plot showing current speed (length of line) and direction toward which the current flows (true north is up in this display).
The time below the data panel is the time for each photograph (in Greenwich Mean Time), computed by evenly spacing the photographs over the deployment. This evenly spaced time and frame number are tabulated in an Excel file to facilitate finding a specific photograph (table 4). A link to the table of photograph times is on each page of thumbnails. The best estimate of the time of the photograph is obtained from the hour and minute recorded by the digital clock on the photograph (in EST) and the day from the data panel (or from the framelist.xls).
Table 4. Links to tables in Excel format that list frame number and frame date and time for each mooring deployment. [GMT, Greenwich Mean Time]
|
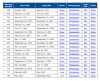 Table 3.
Links to movies, photographs, data plots, and notes.
|