USGS Coastal and Marine Geology Program
|
IntroductionGeologic Setting
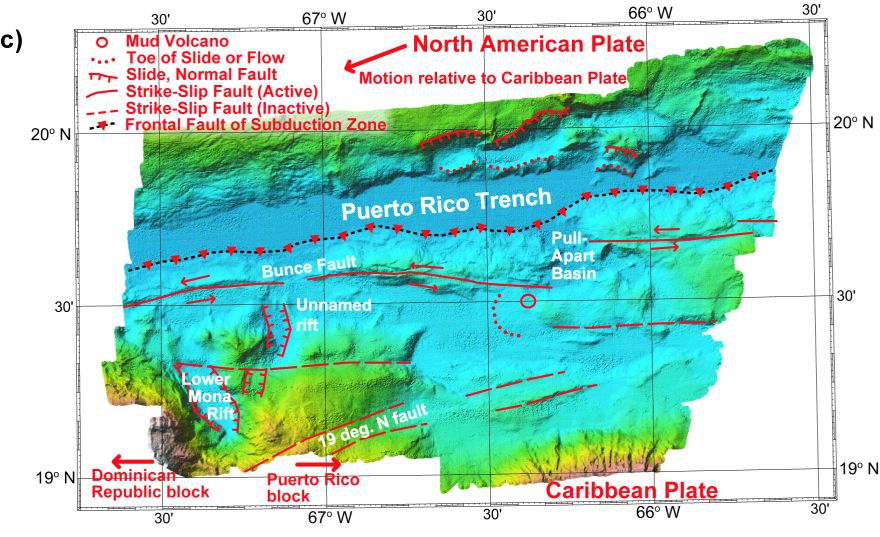
The Puerto Rico Trench lies within the U.S. Exclusive Economic Zone (EEZ) north of Puerto Rico. With water depths of up to 8,350 m it is the deepest place in the Atlantic Ocean, comparable to the deep trenches in the Pacific Ocean (situated along the Ring of Fire). The Pacific trenches are located where one tectonic plate subducts, or slides, under another one. The Puerto Rico Trench, in contrast, is situated at a boundary between two plates that slide past each other with only a small component of subduction. The trench is shallower where the component of subduction is larger. The unusually deep sea floor is not limited to the trench and extends farther south toward Puerto Rico. The Puerto Rico Trench is also associated with the most negative gravity anomaly on Earth, -380 milliGals. Along the southern side of the trench, a carbonate platform, which was originally deposited in flat layers near sea level, is now tilted northward at a uniform angle. Its north edge is at 4,500m depth, and its south edge is observable on land in Puerto Rico at an elevation of a few hundred meters. Several tectonic models have been proposed to explain these unusual observations, and marine explorations of the type reported here are needed to discriminate between them. Many earthquakes and tsunamis resulting from plate-tectonic movements have occurred during historical time in the northeastern Caribbean. As the population in this region continues to grow, future events will pose serious hazards to the 4 million U.S. citizens of Puerto Rico and the Virgin Islands, mainly in the form of submarine faults and landslides. On September 24-30, 2002, six days of scientific surveying to map a section of the Puerto Rico Trench (PRT) took place aboard the National Oceanic and Atmospheric Administration (NOAA) ship Ron Brown. The cruise was funded by NOAA's Office of Ocean Exploration. Multibeam bathymetry and acoustic-backscatter data were collected over an area of about 25,000 sq. km of the Puerto Rico trench and its vicinity at water depths of 4000-8400 m. Weather conditions during the entire survey were good; there were light to moderate winds and 1-2 foot swells experiencing minor chop. The roll and pitch of the ship's interaction with the ocean were not conspicuous. Cruise participants included personnel from USGS, NOAA, and University of New Hampshire Center for Coastal and Ocean Mapping/Joint Hydrographic Center. The cruise resulted in the discovery of a major active strike-slip fault system close to the trench, submarine slides on the descending North American tectonic plate, and an extinct mud volcano, which was cut by the strike-slip fault system. Another strike-slip fault system closer to Puerto Rico that was previously considered to accommodate much of the relative plate motion appears to be inactive. The seaward continuation of the Mona Rift, a zone of extension between Puerto Rico and the Dominican Republic that generated a devastating tsunami in 1918, was mapped for the first time. More details can be found at the USGS Web page on Project Caribbean and Tsunami Earthquake Hazard Studies. Survey MethodsMultibeam bathymetry and backscatter data were acquired using the SeaBeam 2112 multibeam echo sounder. This 12KHz system uses up to 150 beams, mapping a swath of 150 degrees in depths less than 1,000 meters, 120 degrees for depths up to 5,000 meters, and 90 degrees for depths greater than 5,000 meters. The precision of the SeaBeam mapping system is dependent upon the depth of the water: the deeper the water, the narrower the swath width, the longer the pulse width, and the slower the ping rate. Two versions of the Seabeam data acquisition and ping processing software were in use during this survey. The first 13 hours of data were collected using the latest release, v 1.2.7. Unexpectedly noisy returns prompted a switch back to the previous release, v 1.2.5, for the remainder of the six day survey. The noise was just as pronounced with v 1.2.5. However, sub-bottom profiler and backscatter data showed that noise was encountered only in areas of thick sediment on the bottom. Ship's speed was in the 8-9 knot range for most of the survey. This relatively slow pace reduced mapped mileage, but it increased data density, reduced turbulence under the hull, and improved data quality. In the later stages of the survey, in shallower depths, the speed was increased to 10-11 knots with no apparent degradation. Sound VelocityAt the start of the survey, data from a CDT cast to a depth of 2000 m was convereted to a sound velocity profile. The profile was extended to survey depths using historical averages from the levitus database. Curling of the cross track profile in the outer beams did not indicate significant sound velocity errors. During time that the v 1.2.7 software (the current release) was in use the ship's Thermosalinograph was used to estimate surface sound velocity. This capability was lost when the software was changed to 1.2.5 (the previous release), but examination of the surface sound velocity trace over 24 hours showed it to be steady +/- 0.5 m/s, so the capability was not missed. Data ProcessingThe SeaBeam 2112 mapping system was used to acquire the multibeam data and provided a real-time display of the swath width coverage as the cruise progressed. Caris HIPS software (Hydrographic Information Processing) was used to rectify and manually correct selected beam information and gave the team their first view of the soundings as geologic features in a spatially accurate display. Randomly scattered craters that appeared in the outer beams over areas of low reflectivity were reduced in post processing by manual editing, which removed soundings not in close agreement with the majority of soundings. The appearance of furrows that follow the ship's tracks at or near the nadir position is an artifact of processing. The Caris HIPS renderings showed that the furrows were more prominent where the Seabeam v.1.2.7 software was used, while the v.1.2.5 release reduced furrowing to near invisibility. SoftwareCaris HIPsCaris HIPS software was used to clean the data and to render 3-D views of the bathymetry with backscatter overlays. This software embodies a variety of interactive tools for displaying survey data, vessel position, attitudes, bathymetry, and allows the user to edit wild points, smooth the data, and interpolate through data gaps. Its rendering algorithms reveal detail that surpasses the tools currently available on the ship. ArcViewArcView is a desktop geographic information system produced by Environmental Science Research Institute (ESRI). GeoZui3DGeozui3D is an interactive, georeferenced, 3-D zooming, user interface system for visualization
developed by the Data
Visualization Research Lab at the Center for Coastal and Ocean Mapping at the
University of New Hampshire. GeoZui3D is an free viewer that was used to provide an interactive
fly-through of the gridded bathymetry that was constructed by Caris HIPS and refined in Arcview.
|