Skip USGS links group
U.S. Geological Survey - science for a changing world
CZM logo with link to CZM home page

Woods Hole Science Center

End of USGS links group
High-Resolution Geologic Mapping of the Inner Continental Shelf: Nahant to Gloucester, Massachusetts

Title Page / Table of Contents / List of Figures / Introduction / Maps / Data Collection/Processing / Interpretation / Acknowledgments / Appendix 1 / Appendix 2 / Appendix 3 / Appendix 4


Fig. 4.1. Late Quaternary relative sea-level curve for northeastern Massachusetts. Fig. 4.1. Late Quaternary relative sea-level curve for northeastern Massachusetts. Fig. 4.1. Late Quaternary relative sea-level curve for northeastern Massachusetts.

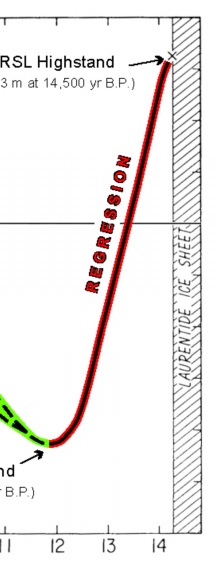
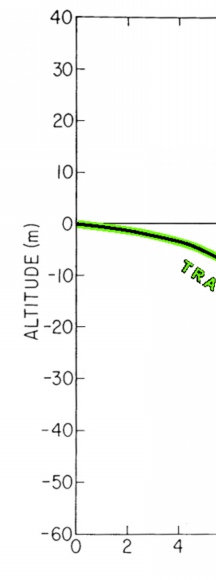
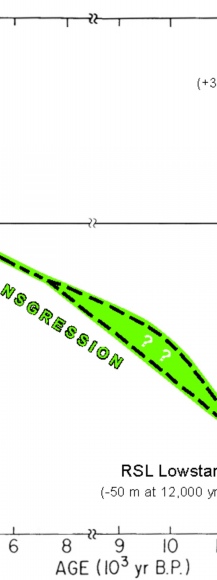
Figure 4.1. Late Quaternary relative sea-level curve for northeastern Massachusetts (modified from Oldale and others, 1993). Over the last 14,500 years, relative sea level fell from a highstand of about +33 m to a lowstand of about -50 m, and then rose at varying rates to the present. These large fluctuations in relative sea level drove regression (red shading) and transgression (green shading) of the shoreline across the inner continental shelf. The dashed lines indicate uncertainty in the sea-level data. Note that the age scale changes at 8,000 years B.P.


Skip Footer Information
Skip Navigation

Accessibility FOIA Privacy Policies and Notices

U.S. Department of the Interior | U.S. Geological Survey | Coastal and Marine Geology

URL: cmgds.marine.usgs.gov/publications/of2005-1293/html/imagepages/fig4_1.html
Page Contact Information: CMGDS Team
Page Last Modified: Wednesday, 06-Dec-2017 12:46:00 EST