Instruments to measure water flow, sea level, conductivity, temperature, wave characteristics, near-bottom turbulence, suspended sediment concentrations, and sea floor bedforms (ripples) were deployed at eight sites (fig. 1) from October 2003 through April 2004. Instruments were deployed from the R/V Dan Moore (fig. 5 and fig. 6), a research vessel owned and operated by Cape Fear Community College in Wilmington, North Carolina. There were two deployments, each three months in duration, with a one week recovery period between deployments. For the first deployment, instruments were deployed on October 28, 2003, and recovered on January 21, 2004. During the one week recovery period beginning January 21, 2004, data was downloaded from the instruments, and the instruments were cleaned and prepared for the second deployment. On January 29, 2004, the instruments were re-deployed. The final recovery of the instruments occurred on April 23, 2004.
Below are descriptions of the tripods deployed at all eight sites. Each description contains the location and water depth of the site, and a listing of the instrumentation deployed on the tripod at the site. Also provided below are descriptions of two surface buoy configurations used in the instrument deployments. Refer to the Instrumentation page for a complete description of the instrumentation. Refer to the Mooring Identification and Mooring Log page for serial numbers, heights, deployment dates, and recovery dates of each instrument.
Site 1 Tripod
Site 1 is located the furthest offshore (33° 38.97´ N 78° 47.35´ W) at a water depth of 11.3 meters. Instrumentation consisted of an Acoustic Doppler Current Profiler (ADCP) that was mounted on a minipod frame (fig. 7).
Site 2 Tripod
Site 2 is the southernmost site (33° 38.93´ N 78° 50.93´ W) and a water depth of 9.4 meters. Instrumentation was mounted to a micropod frame and included an ADCP, a conductivity-temperature sensor (CT), and a pressure sensor (fig. 8).
Site 3 Tripod
Site 3 is the northernmost site (33° 46.43´ N 78° 40.92´ W) and a water depth of 10.8 meters. Instrumentation was identical to Site 2, above, and included an ADCP, a CT, and a pressure sensor (fig. 9).
Site 4 Tripod
Site 4 is located on the southern edge of the sand feature (33° 42.05´ N 78° 47.11´ W) at 9.9 meters water depth. Instrumentation was an ADCP, housed in a trawl-resistant bottom mount (TRBM) (fig. 10).
Site 5 Tripod
Site 5 is located at 9.6 meters water depth, on the northern edge of the sand feature (33° 44.11´ N 78° 45.41´ W). Instrumentation was identical to Site 4, above, an ADCP housed in a TRBM (fig. 11).
Site 6 Tripod
Site 6 is located on the eastern edge of the sand feature (33° 41.41´ N 78° 45.61´ W), at 10.6 meters water depth. Instrumentation, deployed on a flow tripod, included an Acoustic Doppler Profiler (ADP), two Acoustic Doppler Velocimeters (ADV), two Optical Backscatter Sensors (OBS), an Acoustic Backscatter Sensor (ABS), a CT, two pressure sensors, and a rotating sonar (fig. 3).
Site 7A Tripod
Site 7A is located on the western edge of the sand feature (33° 43.35´ N 78° 46.75´ W) at 10.6 meters water depth. Instrumentation, deployed on a flow tripod, included two ADV's, a Pulse Coherent Acoustic Doppler Profiler (PCADP), four OBS's, two pressure sensors, and a CT (fig. 12). An ABS was also added during the second deployment from January 29, 2004 to April 23, 2004.
Site 7B Tripod
Site 7B is also located on the western edge of the sand feature (33° 43.34´ N 78° 46.84´ W), but at a water depth of 11.1 meters. Instrumentation deployed on the tripod included an ADCP, an ABS, and a rotating sonar (fig. 13).
Site 8 Tripod
Site 8 is located on the sand feature 33° 43.02´ N 78° 46.30´ W) at a water depth of 9.4 meters. Instrumentation included an Acoustic Profiler (AP) that was mounted to a miniature tripod (fig. 14).
Sites 1, 2, 3, 6, and 7 Surface Buoys
USGS surface buoys (fig. 15) were deployed adjacent to the tripods at sites 1, 2, 3, 6, and 7 to mark the sites and provide protection from trawl fishing. At sites 2, 3, and 7A, a CT was attached to this surface buoy to measure conductivity and temperature 1-meter below sea level.
Sites 5 and 8 Surface Buoys
The USC Polyform and Hi-Fly buoy arrangement was utilized at sites 5 and 8 to mark the sites and provide protection from trawl fishing (fig. 16).
 To view files in PDF format, download free copy of Adobe Reader. To view files in PDF format, download free copy of Adobe Reader.


 |
Click on the following figures for larger images in PDF format.
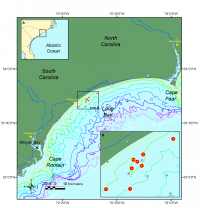
Figure 1. Location Map for Long Bay, South Carolina.
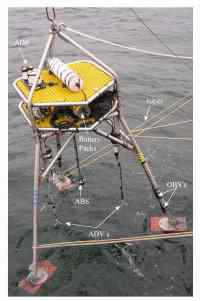
Figure 3. Site 6
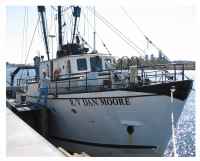
Figure 5. R/V Dan Moore
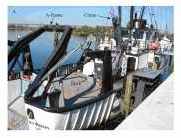
Figure 6. R/V Dan Moore.
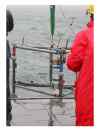
Figure 7. Site 1
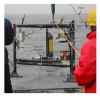
Figure 8. Site 2
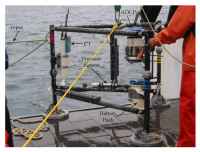
Figure 9. Site 3
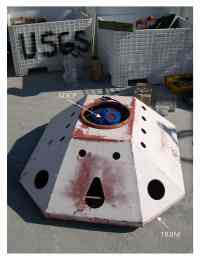
Figure 10. Site 4
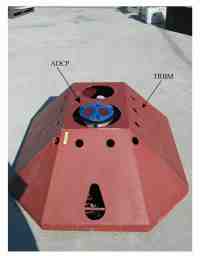
Figure 11. Site 5
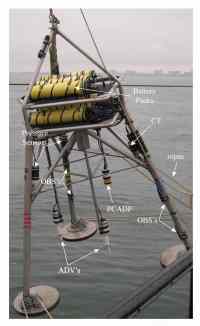
Figure 12. Site 7a
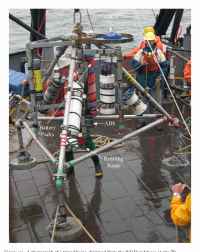
Figure 13. Site 7b
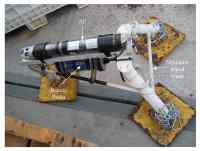
Figure 14. Site 8
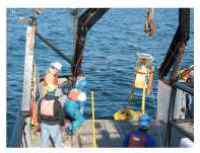
Figure 15 USGS buoy.
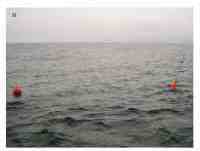
Figure 16. USC buoy.
|
