|
A variety of instruments from several manufacturers were used to measure water flow, sea level, conductivity, temperature, wave characteristics, near-bottom turbulence, suspended sediment concentrations, and sea floor bedforms (ripples). These instruments*, described below, were deployed from October 2003 through April 2004 on a variety of platforms. Data were recorded at sampling schemes specific to each instrument. Refer to the Field Program page, the Mooring Identification and Mooring Log page, and the Summary of Sampling Schemes (PDF format) for site-specific platform and sampling information. Established data processing techniques (see the Data Processing page) were utilized to convert data from these instruments from proprietary format to scientific units for inclusion in this report.
Jump to:
RD Instruments ADCPTM
Nortek Aquadopp AP
SonTek Argonaut-XR
SonTek PCADP
SonTek ADV
Paroscientific Digiquartz Pressure Sensor
Sea-Bird SEACAT
Sea-Bird MicroCAT
D&A Instruments OBS
Aquatec ABS
Imagenex Rotating Sonar
RD Instruments (RDI) Acoustic Doppler Current Profiler (ADCP)
The RDI ADCPTM (http://www.rdinstruments.com/) measures the speed and direction of water flow using Doppler principles. Acoustic pulses are transmitted by the ADCPTMs transducer assembly along two pairs of orthogonal beams (four beams total) (fig. 17, PDF format). Scatterers in the water column, such as small particles and plankton traveling with the water flow, reflect the acoustic pulses. The ADCPTM transducer assembly receives the reflected pulses and, using the Doppler Effect and basic trigonometry, converts the pulses into eastward, northward, and vertical components of water flow. When installed with waves acquisition firmware, RDI ADCPTMs record three different types of time series from which wave properties may be computed: pressure, range to surface along each orthogonal beam (i.e., water level), and orbital velocities of the surface waves taken from three bins nearest the surface in each of the four beams. It is possible to estimate non-directional wave energy spectra, and thus wave height and period, from any of the three time series, but the orbital velocity time series are required for definition of the directional distribution of the wave energy. References for the principles of operation for the Doppler water flow measurement technique may be found at http://www.rdinstruments.com/rdi_library.html. The RD Instruments' primer on ADCPTM wave measurements may be found at http://www.rdinstruments.com/waves.html.
RDI ADCPTMs (600 KHz Workhorse and 1200 KHz Workhorse) were deployed at Sites 1, 2, 3, 4, 5, and 7B (fig. 2, PDF format) from October 2003 through April 2004. The ADCPTMs were deployed on micropod frames at Sites 1, 2, and 3 (fig. 7), on TRBMs at Sites 4 and 5 (fig. 10), and on a small tripod frame at site 7B (fig. 13). The ADCPTMs recorded 5-minute averages of water flow every 15 minutes in 0.5 meter bins. To obtain an accuracy of at least 0.4 cm/s for each 5-minute measurement, 300 pings emitted at a rate of 1 ping per second were averaged together. For wave measurements, the ADCPTMs recorded 20-minute averages of the pressure, range to surface, and orbital velocity time series every 1 hour. This report includes processed ADCPTM water flow and wave measurement data; however, data from Site 5 could not be included due to significant tilt (>25 degrees) of that ADCPTM (fig. 18, PDF format).
Nortek Aquadopp Acoustic Profiler (AP)
The Nortek AquadoppTM AP (http://www.nortek-as.com/) measures water flow and wave characteristics. Similar to an ADCP, the AquadoppTM measures water flow using Doppler principles. The instrument (fig. 19) measures the Doppler shift that occurs when three acoustic beams reflect from scatterers that are carried by the water. Because Doppler shift is proportional to the component of water flow along the beam, trigonometry can be used to convert the returned signal into eastward, northward, and vertical components of water flow. For wave measurements, the AquadoppTM measures wave pressure and near-bed velocities. A method using pressure and the udv components of velocity (PUV) is used to estimate wave parameters. The pressure signal is used to estimate wave height; the measurements of the waves' orbital velocities provide an estimate of the wave direction. Additional information regarding the PUV method of calculating wave parameters is provided at www.nortek-as.com/technotes/PUVWaves.pdf.
Unlike an ADCP, the Aquadopp has three acoustic beams (fig. 19a) which may be arranged in any of five configurations. Each configuration is optimized for certain applications (refer to http://www.nortek.no/brochures/Aquadopp.pdf for additional configurations). For additional information on the Nortek AquadoppTM AP, refer to http://www.nortek-as.com/support/manuals/Aquadopp_Manual.pdf.
A Nortek AquadoppTM AP was deployed at Site 8 (fig. 1) from October 2003 through April 2004 on a miniature tripod frame (fig. 14). The instrument used in this study was configured with a right-angle sensor head configuration, which gave the instrument a low profile and minimized drag. The instrument recorded data using a sampling scheme identical to the ADCPs, which recorded 5-minute averages of water flow every 15 minutes in 0.5 meter bins. An accuracy of at least 0.4 cm/s was obtained for each 5-minute measurement by averaging 300 pings emitted at a rate of one ping per second. For wave measurements, the instrument recorded a 20-minute time series of pressure and wave orbital velocities every 1 hour. Processed AquadoppTM water flow and wave measurement data are included in this report.
SonTek Argonaut-XR (Extended Range) Acoustic Doppler Profiler (ADP)
The SonTek Argonaut-XR (Extended Range) (http://www.sontek.com/) measures water flow using Doppler principles. Similar to an ADCP and an AquadoppTM , the Argonaut-XR measures the Doppler shift that occurs when acoustic beams reflect from scatterers that are carried by the water. Similar to the Nortek AquadoppTM , the SonTek Argonaut-XR has three acoustic beams (fig. 20). Because Doppler shift is proportional to the component of water flow along the beams, trigonometry can be used to convert the returned acoustic signals into eastward, northward, and vertical components of water flow. When installed with the SonWave wave spectra collection package, the SonTek Argonaut-XR can measure wave pressure and near-bed velocities in order to estimate wave characteristics. The SonTek Argonaut-XR Principles of Operation are available at http://www.sontek.com/princop/axr/axrpo.htm.
A SonTek Argonaut-XR (1500 KHz) was deployed at Site 6 (fig. 1) from October 2003 through April 2004 on a large flow tripod frame (fig. 3). This instrument was equipped with the SonWave wave spectra collection package for the measurement of wave characteristics. The instrument recorded data using the same sampling scheme as the ADCPs and the AquadoppTM , which recorded 5-minute averages of water flow every 15 minutes. An accuracy of at least 0.4 cm/s was obtained for each 5-minute measurement by averaging 300 pings emitted at a rate of one ping per second. Data were recorded in bins that were 1-meter in height. The data in the last bin are an average of data for all depths. Processed Argonaut-XR water flow and wave measurement data are included in this report.
SonTek Pulse-Coherent Acoustic Doppler Profiler (PCADP)
The SonTek PCADP (http://www.sontek.com/) measures water flow using Doppler principles. Similar to other acoustic water flow instruments, the PCADP measures the Doppler shift that occurs when acoustic beams reflect from scatterers that are carried by the water (fig. 21). However, each PCADP measurement uses a pair of acoustic pulses, unlike the single pulse acoustic water flow instruments described above. Compared to single acoustic pulse instruments which measure water flow as averages of sections of the beam that are 50 centimeter or longer, paired acoustic pulse instruments provide higher spatial resolution by measuring water flow measurement regions as short as 1.6 cm along the beam. Refer to http://www.sontek.com/product/pcadp/pcaxdsc.htm for additional information.
A SonTek PCADP was deployed at Site 7A (fig. 1) from October 2003 through April 2004 on a large flow tripod frame (fig. 12). The instrument recorded 20 minute averages of water flow in vertical bins 9.5 centimeters high every 1 hour. The bin size was 9.5 centimeters. Processed PCADP water flow data are included in this report.
SonTek Acoustic Doppler Velocimeter (ADV)
The SonTek ADV (http://www.sontek.com/) measures water flow using Doppler principles. Similar to other acoustic water flow instruments, the ADV measures the Doppler shift that occurs when scatterers reflect sound from three acoustic beams. However, the beams are oriented downward (fig. 22) to measure water flow in a small volume of water below the transducer. Because Doppler shift is proportional to the velocity component along the beam, trigonometry can be used to convert the returned signal into eastward, northward, and vertical components of water flow.
Sontek 10-MHz and 5-MHz Ocean ADVs were deployed on large tripod frames at Site 6 (fig. 3) and Site 7A (fig. 12), respectively, from October 2003 through April 2004. At Site 6, the ADVs recorded 11 minute averages of water flow 10 centimeters below the sensor head every 1 hour. At Site 7A, the ADVs recorded 20 minute averages of water flow 18 centimeters below the sensor head every 1 hour. Processed ADV water flow data are included in this report.
Paroscientific (Paros) Digiquartz® Pressure Sensors
The Paros Digiquartz® Pressure sensor (http://www.paroscientific.com/) (fig. 23) measures pressure using a quartz crystal resonator. The frequency of oscillation of this resonator varies with pressure induced stress. The output pressure is compensated for temperature by using the signal from temperature-sensitive crystals which are a component of the instrument. Refer to http://www.paroscientific.com/pdf/dqadvantage.pdf for additional information on Digiquartz® technology.
Paros Digiquartz® pressure sensors were deployed at Sites 2, 3, 6, and 7A (fig. 1) from October 2003 through April 2004. At Sites 2 and 3, the sensors were deployed on micropod frames (fig. 8) and the sampling interval was matched to that of the SEACATs (described below) and MicroCATs (described below), typically every 5 minutes. At Sites 6 and 7A, the sensors were deployed on large flow tripod frames (fig. 3), the sampling interval was matched to that of the ADVs (above), typically 11 minutes every 1 hour. Processed Paros pressure data are included in this report.
Sea-Bird SEACAT 16
The Sea-Bird SEACAT 16 (http://www.seabird.com/) measures conductivity and temperature. Salinity can be calculated with these measurements (fig. 24). The instruments were equipped with pumps to flush the sensor ducts and reduce salinity spiking. Auxiliary external sensors, such as those for dissolved oxygen, pH, or turbidity, may be attached to the instrument. Data is recorded internally on FLASH RAM memory.
Sea-Bird SEACATs were deployed at Sites 2, 3, and 6 (fig. 1) from October 2003 through April 2004. The instruments were deployed on micropod frames at sites 2 and 3 (fig. 8), and on a large flow tripod frame at site 6 (fig. 3). Sampling occurred every 5 minutes. Processed SEACAT conductivity, temperature, and salinity data are included in this report.
Sea-Bird MicroCAT
The Sea-Bird MicroCAT (http://www.seabird.com/) is a lower cost, simpler version of the SEACAT 16. The MicroCAT uses the same sensor technology (fig. 25) as the SEACAT to collect salinity and temperature data, but cannot record data from auxiliary external sensors. MicroCATs are also smaller in size, which enables their deployment on USGS surface buoys (fig. 16).
Sea-bird MicroCATs were deployed at Sites 2, 3, 6, and 7A (fig. 1) from October 2003 through April 2004 on USGS surface buoys. The instruments were 1 meter below the water surface. The sampling interval was matched to that of the SEACATs, typically every 5 minutes. This report includes processed MicroCAT conductivity, temperature, and salinity data.
D&A Instruments Optical Backscatter Sensor (OBS)
The D&A Instruments OBS-3 (http://www.d-a-instruments.com/) measures turbidity in the water column. The sensor (fig. 26) emits a beam of infrared light that is scattered by suspended sediments. Suspended sediment concentration can be derived by combining the quantity of light reflected back to the sensor (backscatter) with instrument calibration coefficients.
D&A Instruments OBS-3s were deployed at Sites 6 and 7A (fig. 1) from October 2003 through April 2004. The OBSs were deployed on large flow tripods at both sites (fig. 3). The sampling intervals used for the OBSs match those of the ADVs deployed at Site 6 and Site 7A. At Site 6, the OBSs recorded 11 minute averages of turbidity every 1 hour. At Site 7A, 20 minute averages of turbidity were recorded every 1 hour. This report includes OBS backscatter data.
Aquatec Acoustic Backscatter Sensor (ABS)
The Aquatec ABS (http://www.aquatecgroup.com/) also measures turbidity in the water column. However, unlike the OBSs described above, the ABS sensors emit pulses of high frequency sound from up to four transducers (fig. 27) which may operate at different frequencies. These pulses are scattered by suspended sediments in the water column. The quantity of sound scattered back to the sensor (backscatter) can be combined with instrument calibration coefficients to determine vertical profiles of suspended sediment concentrations.
Aquatec ABSs were deployed at Sites 6, 7A, and 7B (fig. 2) from October 2003 through April 2004. The ABSs were deployed on large flow tripods at Site 6 and Site 7A (fig. 3), and on a small tripod frame at Site 7B (fig. 13). At Site 6, the ABS recorded 13 minute averages of turbidity every 1 hour. At Site 7A and Site 7B, the ABS recorded 22 minute averages of turbidity every 1 hour. This report includes ABS backscatter data.
Imagenex Rotating Sonar
The Imagenex rotating sonar (http://www.imagenex.com/) produces images of sea floor bedforms. The sonar emits a beam of high frequency sound over the sea floor by either rotating or moving in a straight line depending on the model. The sound reflects off objects and bedforms on the sea floor. The length of time required for the reflected sound to return to the sensor is used to generate an image of sea floor bedforms.
Imagenex rotating sonar models 881A (Pencil-beam profiling sonar) (fig. 28) and 881 (tilt adjust imaging sonar) (fig. 29) were deployed at Site 6 and Site 7B (fig. 2), respectively, from October 2003 through April 2004. The Pencil-beam profiling sonar (881A) was deployed on a large flow tripod frame at Site 6. At Site 7B the imaging sonar (881B) was deployed on a small tripod frame. The 881B sonar collected three images every 5 hours which were averaged to produce a single sonar image. Animations of these Imagenex images are included in this report.
*The use of trade names in this Web site is for identification purposes only and does not imply endorsement by the United States Geological Survey. |
Click on the following figures for larger images in PDF format.
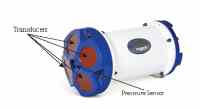
Figure 17. A photograph of an RD Instruments Acoustic Doppler Current Profiler (ADCP).
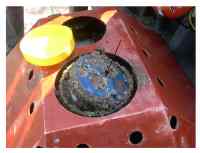
Figure 18. A post-recovery photograph of the ADCP deployed at Site 5.
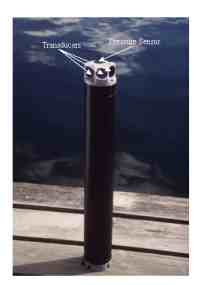
Figure 19. A photograph of an Aquadopp Acoustic Profiler (AP)) manufactured by Nortek-AS.
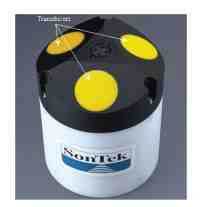
Figure 20. A photograph of a SonTek Argonaut-XR (Extended Range) Acoustic Doppler Profiler
(ADP).
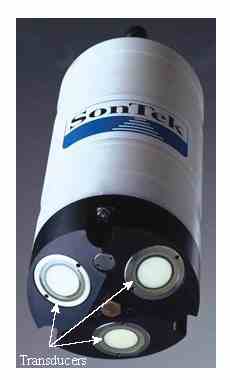
Figure 21. A photograph of a SonTek Pulse-Coherent Acoustic Doppler Profiler (PCADP).
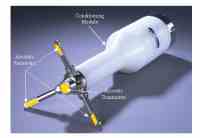
Figure 22. A photograph of a 5-MHz Ocean Acoustic Doppler Velocimeter (ADV) manufactured by SonTek corporation.
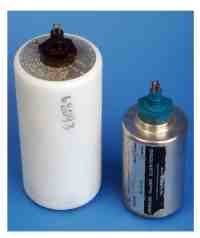
Figure 23. A photograph of Paroscientific Digiquartz® pressure sensors.
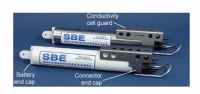
Figure 24. A photograph of the SEACAT 16 conductivity and temperature sensor manufactured
by Sea-Bird Electronics.
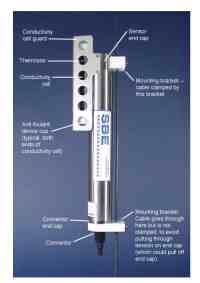
Figure 25. A photograph of a MicroCAT conductivity and temperature sensor manufactured by
Sea-Bird Electronics.
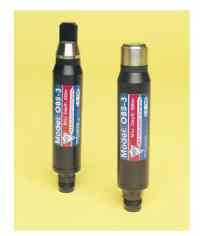
Figure 26. A photograph of D&A Instruments Optical Backscatter Sensors (OBS).
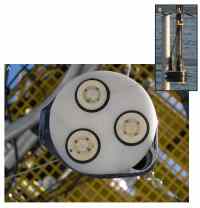
Figure 27. A photograph of D&A Instruments Optical Backscatter Sensors (OBS).
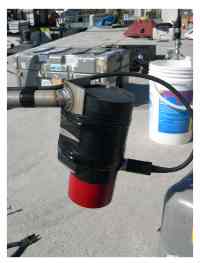
Figure 28. A photograph of the Imagenex 881A imaging sonar.
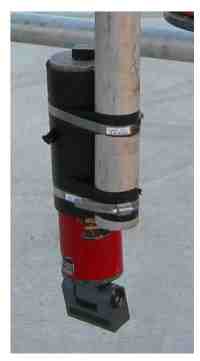
Figure 29. A photograph of the Imagenex 881 tilt-adjusting imaging sonar.
|