 |
Figure 1. Map showing location of NOAA survey H11255 (light blue cross-hatched polygon). Other multibeam surveys by the NOAA ship Thomas Jefferson are shown in dark blue. Also shown are the sites of USGS sidescan sonar surveys in Long Island Sound: Norwalk--Twichell and others (1997); Milford--Twichell and others (1998); New Haven Harbor and New Haven Dumping Grounds--Poppe and others, 2001; Roanoke Point--Poppe and others (1999a); Falkner Island--Poppe and others (1999b); Hammonasset--Poppe and others (1997); Niantic Bay--Poppe and others (1998a); New London--Zajac and others (2000, 2003); Fishers Island Sound--Poppe and others (1998b). Sidescan sonar and bathymetric surveys H11043 (Poppe and others, 2004), H11044 (McMullen and others, 2005), and H11045 (Beaulieu and others, 2005) completed by the NOAA ship RUDE are shown in light green. |
 |
Figure 2. Port-side view of the NOAA Ship Thomas Jefferson at sea. Note that the 30-foot survey launch normally stowed on this side of the ship has been deployed. |
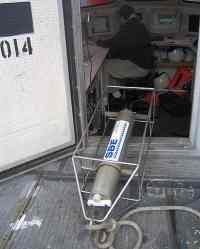 |
Figure 3. CTD (conductivity-temperature-depth) profiler shown on the deck of the NOAA ship Thomas Jefferson. Data derived from frequent deployments of this device were used to correct for variations in sound velocity throughout the water column. |
 |
Figure 4. Digital terrain model (DTM) of the sea floor in southeastern Long Island Sound produced from multibeam bathymetry collected during NOAA survey H11255. Image is sun-illuminated from the north and vertically exaggerated 10X. Hotter colors are shallower areas; cooler colors are deeper areas. See key for depth. |
 |
Figure 5. Subbottom profile from line 17 in southeastern Long Island Sound collected during RV ASTERIAS cruise 83-2 (Needell and others, 1987; Poppe and others, 2002a). Location of profile is shown in Figure 8. Profile and interpretation show the thinning of the Holocene marine unit in the axial trough, relatively smooth nature of the sea floor, and acoustic character of the underlying units. |
 |
Figure 6. Subbottom profile from line 15 in southeastern Long Island Sound collected during RV ASTERIAS cruise 83-2 (Needell and others, 1987; Poppe and others, 2002a). Location of profile is shown in Figure 8. Profile and interpretation show the thinning of the Holocene marine unit in the axial trough, relatively smooth nature of the sea floor, and acoustic character of the underlying units. Gas within the marine unit obscures some of the underlying strata. |
 |
Figure 7. 11 Subbottom profile from line 11 in southeastern Long Island Sound collected during RV ASTERIAS cruise 83-2 (Needell and others, 1987; Poppe and others, 2002a). Location of profile is shown in Figure 8. Profile and interpretation show the thinning of the Holocene marine unit in the axial trough, relatively smooth nature of the sea floor, and acoustic character of the underlying units. Gas within the marine unit obscures some of the underlying strata. |
 |
Figure 8. Interpretation of the bathymetry from NOAA survey H11255. Shown is the area characterized by sedimentary furrows. Also shown are the locations of a pipeline/cable, anchor scars, a shipwreck, semi-isolated depressions, the detailed multibeam view of the sea floor shown in Figure 9, and the locations of the seismic profiles shown in figures 5, 6, and 7. |
 |
Figure 9. Detailed view of sedimentary furrows from the southwestern corner of NOAA survey H11255. "Tuning fork" joining pattern exhibited by some of the furrows typically open to the east (right) suggesting net westward transport. Location of this view and distribution of sedimentary furrows are shown in Figure 5. |
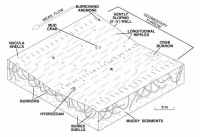 |
Figure 10. Image shows a perspective view of an idealized sedimentary furrow in the muddy cohesive sediments of Long Island Sound. Figure shows the linear depression with gently sloping walls, longitudinal ripples, bioturbation, and nucula shells. |
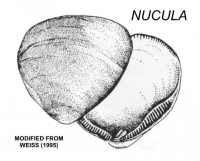 |
Figure 11. Image of Nucula SPP (Weiss, 1995). These bivalves, locally known as Nutclams, range up to 6 mm long and are common in muddy bottom sediments within Long Island Sound. |
 |
Figure 12. Map from Poppe and others (2000a) showing the distribution of surficial sediments in east-central Long Island Sound. Map also shows the locations of NOAA surveys H11043 and H11255, the USGS CLIS Dumping Ground survey, and the areas within those surveys where sedimentary furrows have been observed to occur (hatched areas). Note that sedimentary furrows only occur within areas characterized by muddy sediments. |
 |
Figure 13. Map from Knebel and Poppe (2000) showing the distribution of sedimentary environments in east-central Long Island Sound. Map also shows the locations of NOAA surveys H11043 and H11255, the USGS CLIS Dumping Ground survey, and the areas within those surveys where sedimentary furrows have been observed to occur (hatched areas). Note that sedimentary furrows only occur within areas with environments characterized by long-term deposition. |
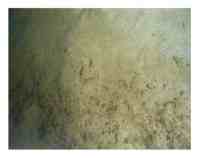 |
Figure 14. Bottom photograph showing an example of a sedimentary environment characterized by deposition. Note the muddy sediment and abundant polychaete and amphipod tubes. Bottom photo is from Niantic Bay in Long Island Sound (Poppe and others, 2000b). |
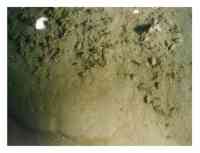 |
Figure 15. Bottom photograph showing an example of a sedimentary environment characterized by sorting or reworking. Note the sandy muddy sediment and scattered shell debris. Bottom photo is from Niantic Bay in Long Island Sound (Poppe and others, 2000b). |
 |
Figure 16. Schematic representation showing a possible mechanism (modified from Flood (1983) for the formation of sedimentary furrows in southeastern Long Island Sound. Secondary helical flow patterns sweep coarse material, such as nucula shells or sand, into linear zones of convergence. These relatively coarse particles are driven by tidal currents and cut furrows into soft, cohesive sediments. |
 |
Figure 17. Map showing the distribution of sedimentary furrows in east-central Long Island Sound. Areas where sedimentary furrows have been observed are shown in black hatching; areas where the furrows are interpreted to occur are shown in red hatching. |
