USGS Coastal and Marine Geology Program
Geophysical Mapping of Oyster Habitats in a Shallow Estuary; Apalachicola Bay, Florida
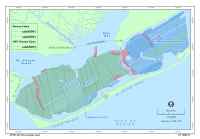
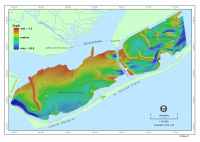
Bathymetric DataAboard the R/V Rafael, an SEA Submetrix 2000 Series interferometric sonar, operating at a frequency of 234 kHz, was used to collect bathymetric data along survey track lines spaced ~ 100 m apart (fig. 3). The instrument was mounted on a rigid pole at the bow of the vessel and was deployed 1 m below the water surface. A GPS antenna was mounted on top of the pole over the sonar head to record ship position during the surveys. The interferometric-sonar system has two channels that collect depth data in a continuous swath on both sides of the vessel. The width of the swath was generally 7-10 times the water depth. For example, in water depths of 3 m, the interferometric sonar can achieve a 15 m range to each side of the ship's track, or 30 m total swath width. Within Apalachicola Bay, swath widths were generally between 20 and 40 m. Single-beam bathymetry was derived from chirp, seismic-reflection profiles collected by ASV IRIS along track lines that were spaced ~ 75 m apart (fig. 3). The bay floor along each chirp profile was digitized and sampled at 50 shot intervals, or approximately every 3-5 m along the survey track, depending on vessel speed. Depths were digitized in two-way travel times and converted to depths in meters using a velocity of sound in water of 1500 m/s, then exported as XYZ soundings. The motion (heave, pitch, roll, and yaw) onboard R/V Rafael was recorded with a TSS DMS 2-05 attitude sensor mounted immediately above the SEA Submetrix 2000 Series transducers. The interferometric sonar is an angle-measuring system; depth accuracy decreases with increasing horizontal range. The combined angular accuracy of the SEA Submetrix 2000 Series and the TSS DMS 2-05 attitude sensor is documented as 0.1 degrees. Assuming constant angular accuracy, and using the International Hydrographic Organization (IHO, http://www.iho.shom.fr/) standard requirement of 0.3 m accuracy in < 30 m water depth, all data collected during the two surveys fall within the IHO accuracy standards. However, vertical accuracy is also directly affected by the accuracy of navigation data and tidal measurements. RTK-DGPS vertical accuracy is assumed to be 0.05 to 0.1 m. The real-time RTK setup included a reference base station on St. George Island and a radio repeater on the highest section of the Bryant Patton Bridge to ensure complete area coverage. The GPS reference station was established on St. George Island using a 3 day average of positions from six 12 hour datasets. The positions were calculated for these datasets using the Online Position Service (OPUS) provided by the National Geodetic Service (http://www.ngs.noaa.gov/OPUS/What_is_OPUS.html). The GPS-RTK vertical was calibrated to the tidal benchmark MLLW at the Apalachicola River Station ID 8728690. Seamless bathymetric coverage for the entire survey area was not feasible, due to the bay's relatively shallow nature and time constraints. Instead, survey lines were designed to provide 100% coverage with sidescan-sonar data, but using the wider swath of the sidescan-sonar coverage resulted in gaps between adjacent interferometric bathymetry swaths. Data gap widths varied as a function of water depth. In the deepest portion of the survey area, near West Pass, data gaps were 10-20 m, and in the shallowest section, south of the town of Apalachicola, data gaps were ~ 80 m (fig. 3). Swath data were processed and gridded using Linux-based SwathEd software (UNB, 2005). The bathymetric data have a vertical resolution of approximately 1% of water depth. The final swath bathymetric grid was produced using a 2 m/pixel resolution and delivered as a GeoTIFF raster image. Swath and single-beam bathymetric data were used as inputs for a regional bathymetric model that provided 100% coverage of the area through interpolation (fig. 4 and Mapsheet 1). Production of the model required three processing steps. First, a Triangulated Irregular Network (TIN) model was generated using the track-line swath (5-m cell size, including interline gaps), and single-beam (derived from ASV IRIS seismic-reflection profiles) bathymetric data. Second, the TIN model was converted to a 25-m cell-size raster grid using the Natural Neighbors method. Finally, a low-pass, 3 x 3 filter was applied to smooth irregular features within the 25-m grid. Complete details of these methods are described in the raster metadata in Section 5. |
Click on figures for larger images.
|
![]() Title |
Figures |
1-Introduction |
2-Data Collection and Processing |
3- Geologic Interpretation |
4-References |
5-Maps |
Spatial Data |
Acknowledgments
Title |
Figures |
1-Introduction |
2-Data Collection and Processing |
3- Geologic Interpretation |
4-References |
5-Maps |
Spatial Data |
Acknowledgments