USGS Coastal and Marine Geology Program
Sea Floor Image Maps Showing Topography, Sun-Illuminated Topography, Backscatter Intensity, Ruggedness, Slope, and the Distribution of Boulder Ridges and Bedrock Outcrops in the Stellwagen Bank National Marine Sanctuary Region off Boston, Massachusetts
|
|||||||||||||||||||||||||||||||
|
Page C. Valentine, editor
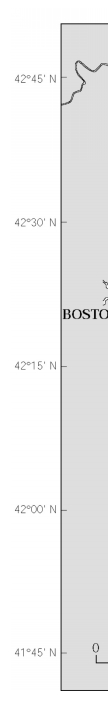
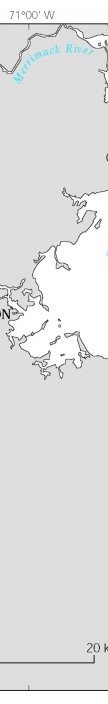
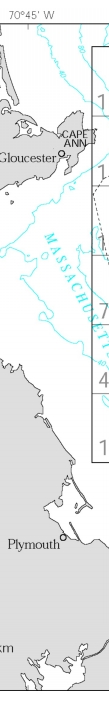
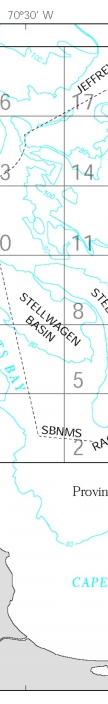
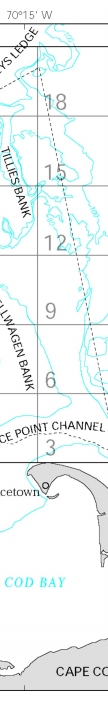
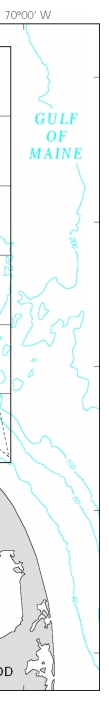
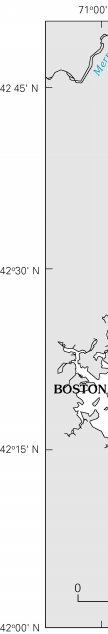
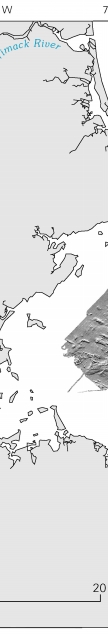
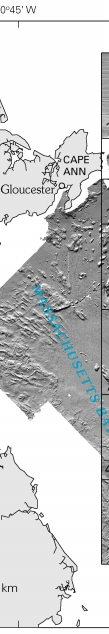
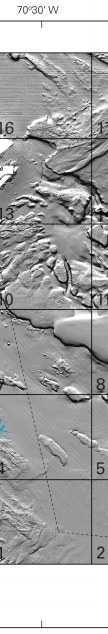
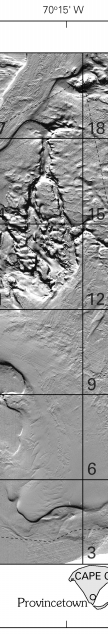
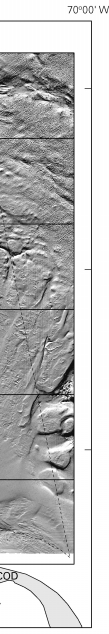
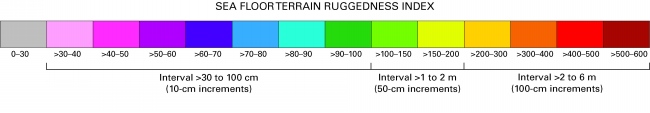
Sheet 1.— General sea floor ruggedness and topography. DiscussionIntroduction Sea floor mapping in the Stellwagen Bank National Marine Sanctuary (NMS) is a cooperative effort of the U.S. Geological Survey (USGS) and the National Oceanic and Atmospheric Administration, with technical support from the University of New Brunswick and the Canadian Hydrographic Service. The maps generated from this undertaking are based on a 1994–96 survey that used a multibeam echo sounder to map 1,100 square nautical miles of the sea floor (fig. 1). The technology and methods of image acquisition and topographic contouring that were used are described in publication 4 in the References section. USGS Scientific Investigations Maps (SIM) 2840–A to –F constitute a six-map (twelve-sheet) series in digital (DVD-ROM) format. The first three maps, SIM 2840–A, –B, and –C, were previously published on paper as USGS Geologic Investigations Series Maps I–2676–A, –B, and –C (publications 43–45 in the References). Preliminary versions of those three maps also had been released earlier on a CD-ROM as USGS Open-File Report 00–410 (publication 42). The map area shown here is a composite of 18 individual quadrangle maps (fig. 1). Two map series of the 18 quadrangles have been published at a scale of 1:25,000 and show sea floor topography (publications 4–22) and sun-illuminated sea floor topography (fig. 2; see publications 23–41). Selected sea floor maps, photographs, CD-ROMs, fact sheets, posters, and geographic names related to research conducted in the Stellwagen Bank NMS region are available online at USGS Web site http://woodshole.er.usgs.gov/project-pages/stellwagen/index.html. See the References section for a complete numbered list of publications. Sea floor ruggedness Terrain ruggedness index Map D comprises five sheets showing various combinations of contoured and sun-illuminated topographic imagery and presentation of sea floor ruggedness. Our use of the terrain ruggedness index (TRI) concept is based on an approach developed by Riley and others in 1999 (publication 48) to calculate differences in elevation between neighboring areas of the Earth's surface. On this map the TRI uses information from the digital bathymetric (topographic) dataset to calculate the ruggedness of the sea floor. On Sheets 1 to 5 we have simplified the TRI of Riley and others (publication 48) to represent the average change in elevation in meters between a center cell (image pixel) and its eight neighboring cells, arrayed in a three-pixel by three-pixel format (publication 46). Each pixel represents an area measuring 13 m on a side. Therefore, the TRI shows the average change in elevation between a central pixel measuring 13 x 13 m (169 m²) and the surrounding eight pixels (1,352 m²). No point in the nine-pixel area lies more than 18.4 m from the central pixel. The resolution of the bathymetric dataset determines the resolution of the seabed features that can be recognized by using this analytical technique. For example, terrain ruggedness indices derived from 13-m-pixel data are not comparable with TRI values of the same magnitude that have been derived from 10-m-pixel data. Average changes in elevation (the terrain ruggedness, or TRI, values) are shown on this map in three intervals: >30 to 100 cm, >1 to 2 m, and >2 to 6 m. All map sheets except Sheet 1 show in gray tones those areas having a TRI less than or equal to 30 cm. Sheets 1 and 2 show the entire range of sea floor ruggedness in the region, where ruggedness values range incrementally from >30 cm to 6 m and are shown in color (fig. 3). Sheets 3, 4, and 5 emphasize selected sea floor ruggedness intervals, in color. Sheet 3 shows only the ruggedness interval between >30 and 100 cm, in 10-cm increments; Sheet 4 shows only the ruggedness interval between >1 and 2 m, in 50-cm increments; and Sheet 5 shows only the ruggedness interval between >2 and 6 m, in 100-cm increments. On these maps, we have taken a new approach in displaying sea floor ruggedness values by portraying them over a range of four elevation-change intervals, each in different increments, in order to recognize and illustrate better the variety of features of varying sizes that shape the seabed. We found that displaying ruggedness values only in 10-cm increments produced numerous TRI increments; and the many different colors required to represent them made it difficult to interpret seabed features. Conversely, by displaying ruggedness values only in increments of several meters, we could not clearly differentiate features such as small ridges and mounds whose lesser relief provides the structural setting for the geological and biological processes that form important seabed habitats. Interpretation The description of seabed features and bottom types in this discussion is based on topographic imagery and backscatter intensity (Maps B and C of this series), on video and (or) photographic imagery from 2,868 stations (Map F, Sheet 3 of this series), and on geological sediment texture analysis from 2,633 stations in the map region. Gray tones on the map (Sheets 2–5) are areas having terrain ruggedness values in the 0- to 30-cm range that are characteristic of the following types of terrain: (1) smooth basin floors (Stellwagen and Scantum Basins); (2) smooth, gently-sloping bank margins (northern margin of Northwest Corner; southern Stellwagen Bank); (3) very low dunes, ridges, and mounds (northeastern Stellwagen Bank); (4) shallow irregular depressions (Western Spur, Lower Stellwagen Bank); and (5) shallow, elongate iceberg scours (Lower Jeffreys Ledge). Ruggedness values in this interval also depict unnatural-looking stripes and patterns oriented parallel or perpendicular to survey tracklines that are artifacts of data collection (Stellwagen and Scantum Basins; Jeffreys Ledge and Stellwagen Bank). These artifacts, when represented by the TRI on the map, tend to obscure real seabed features, and it is preferable to rely on the sun-illuminated topographic imagery alone (not the TRI) for recognition of feature types that have ruggedness values in the 0- to 30-cm range. Pink, purple, blue, turquoise, and dark-green tones on the map represent ruggedness values in the >30- to 100-cm range, in 10-cm increments (Sheets 1, 2, 3) and depict a wide range of small-scale features such as (1) boulder ridges derived from glacial eskers and moraines on bank upper surfaces (Gloucester Bank, Polygon Bank, Ellipse Bank, Tillies Bank, Jeffreys Ledge); (2) irregular basin floors (East and West Tillies Basins, base of Polygon Bank, base of East Ninety Bank); (3) deep, elongate iceberg scours (eastern side of the map region northward from 42°30' N.); (4) sand dunes (northeast Stellwagen Bank at 42°25' N., 70°12' W.; west of Ninety Meter Banks along 70°07.5' W.); and (5) gentle slopes of banks, valleys, and basins (Gloucester Bank, Thacher Bank, parts of Jeffreys Ledge and Stellwagen Bank). Yellowish-green, yellow, orange, and red tones on the map represent ruggedness values in the >1- to 2-m range (in 50-cm increments) and in the >2- to 6-m range (in 100-cm increments) (Sheets 1, 2, 4, 5) and outline banks and basins carved from the sea floor by glacial ice. These ruggedness values occur on the following large-scale features: (1) steeply sloping flanks of large banks bounding large basins (Southwest Corner, Western Spur, Western Edge, Northwest Corner, Lower Stellwagen Bank, southern part of Jeffreys Ledge); (2) small banks separated by narrow, deep basins (Tillies Bank, Creed Ridge, Polygon Bank, Ellipse Bank, Ninety Meter Banks); (3) bank remnants that lie within large basins (East and West Breakwater Banks, Fifteen Bank, The Stone Wall, Scantum Spur); and (4) steep bedrock hills (East and West Pigeon Hills, Sanctuary Hill, East Hill). On Sheets 1 to 5, the areas of the sea floor represented by the four TRI intervals (0–30 cm; >30–100 cm; >1–2 m; and >2–6 m) were calculated for each of the 18 quadrangles as well as for the area of the Stellwagen Bank NMS that lies in each quadrangle (see table 1). By far, the largest component of sea floor in the mapped area (85.4 percent) is relatively smooth (TRI 0–30 cm), and a comparison with the backscatter intensity map (Map C of this series) shows that seabed types with this TRI have sediment textures that range from mud to sand to gravelly sand. Seabed that is somewhat more rugged (TRI >30–100 cm) composes the next largest area of the region (12.8 percent) and represents a wide range of sediment textures that include mud, sand and gravel, and boulders; and features such as boulder ridges, mud-draped gravel mounds, iceberg scours, and low-angle slopes. Sea floor having the highest ruggedness values (TRI >1–2 m and >2–6 m) makes up only 1.8 percent of the seabed and typically is found on the relatively steep slopes of bedrock outcrops and flanks of banks covered by mud, sand, and gravelly sand. These values for the region as a whole also are representative of the seabed within the Stellwagen Bank NMS that is outlined by the dashed line on the map. Sea floor ruggedness is not distributed evenly throughout the map region, and this is reflected in the color intervals on the map and in the area calculations in table 1. The highest topographic variability, and the greatest range in ruggedness values, occur (1) where there are many small close-lying banks and basins (Tillies; Polygon; Ellipse Bank and Stenos Basin; Creed Ridge and Basin; Ninety Meter Banks); (2) in the vicinity of bedrock outcrops (Sanctuary Hill, East Hill, East and West Pigeon Hills), and (3) along the margins of large banks (Stellwagen Bank and Jeffreys Ledge). Upwelling and oceanographic temperature fronts characteristically occur in areas of high topographic variability. Relatively smooth seabed having TRI values in the 0- to 30-cm range constitutes 89 to 98 percent of the sea floor in 10 of the 18 quadrangles (1–9, 16) and 81 to 85 percent of the sea floor in 4 other quadrangles (10, 12, 13, 17). In Quadrangle 10 of this latter group, 81.2 percent of the seabed has a TRI index of 0 to 30 cm and is relatively smooth; but 16.6 percent of the remaining seabed has an index of >30 to 100 cm, much of which represents boulder ridges (see Map F of this series). The remaining four quadrangles (11, 14, 15, 18) show the highest topographic variability, and each has less than 80 percent relatively smooth seabed (TRI 0–30 cm). In Quadrangle 11, 33.5 percent of the seabed has a TRI index of >30 to 100 cm, which represents to a large extent gently inclined bank and basin margins and to a small extent boulder ridges; 11.2 percent of the quadrangle has a TRI index of >1 to 6 m, which represents steeply inclined bank margins. Quadrangle 14 lies on the northern boundary of Quadrangle 11 and is somewhat similar to it geomorphologically; 20.7 percent of the seabed has a TRI index of >30 to 100 cm (owing primarily to gently inclined bank and basin margins and boulder ridges), and 6.4 percent has a TRI index of >1 to 6 m (steeply inclined bank margins). Quadrangles 15 and 18 contain large areas of seabed having a TRI index of >30 to 100 cm (21.7 and 39.9 percent, respectively) that represents iceberg scours that are 5 to 10 m deep, 50 to 100 m wide, and up to several kilometers in length. The TRI alone does not allow reliable interpretation or comparison of sea floor compositions or feature shapes. Seabed terrains having similar ruggedness values can represent a diverse suite of bottom types. Terrain ruggedness analysis is useful for describing sea floor geomorphology and for identifying the effects of seabed processes when combined with interpretations of seabed sun-illuminated topographic imagery, backscatter intensity, video and photographic imagery, and sediment texture analysis. The map region is characterized by highly variable seabed topography. Terrain ruggedness indices are portrayed in 10-cm, 50-cm, and 100-cm increments in order to delineate relatively small but significant features (boulder ridges; irregular basin floors; deep, elongate iceberg scours; sand dunes; low-angle slopes of banks, valleys, and basins) from large features (steep flanks of large banks bounding large basins; small banks separated by narrow, deep basins; bank remnants that lie within large basins; and steep bedrock hills). Seabed processes alter seabed ruggedness over time. Sediment deposition decreases ruggedness by smoothing small-scale features (for example, mud deposited on boulder ridges) and by reducing the steepness of large-scale bank margins (for example, sand eroded from the bank top and transported to the bank margin). Sediment erosion increases small-scale ruggedness by removing sand and mud from glacial features to leave sharply defined boulder and cobble ridges. See Map E of this series for a discussion of sea floor geomorphology based on seabed slope analysis. References USGS publications can also be purchased from USGS Information Services, Box 25286, Denver Federal Center, Denver, CO 80225-0046; telephone (303) 202-4200 or 1-888-ASK-USGS Massachusetts Bay Disposal Site—Maps and Features 1. Valentine, P.C., Baker, J.L., Unger, T.S., Evans, John, and Polloni, C.F., 1999, Sea floor topographic, backscatter, and interpretive maps and bottom photos of the Massachusetts Bay Disposal Site region off Boston, Massachusetts: U.S. Geological Survey Open-File Report 98–344, 1 CD-ROM. (Also available online at http://pubs.usgs.gov/of/of98-344/) 2. Valentine, P.C., Danforth, W.W., Roworth, E.T., and Stillman, S.T., 1996, Maps showing topography, backscatter, and interpretation of sea floor features in the Massachusetts Bay Disposal Site region off Boston, Massachusetts: U.S. Geological Survey Open-File Report 96–273, 2 sheets, scale 1:10,000 and 1:12,500. Massachusetts and Cape Cod Bays and Stellwagen Bank National Marine Sanctuary—Sea Floor Topography 3. Valentine, P.C., Schmuck, E.A., Signell, R.P., and Ryland, C.A., 1995, Sea floor topography of Massachusetts and Cape Cod Bays and Stellwagen Bank National Marine Sanctuary: U.S. Geological Survey Open-File Report 95–073, scale 1:100,000. Stellwagen Bank National Marine Sanctuary—Sea Floor Topography 4. Valentine, P.C., Baker, J.L., Unger, T.S., and Polloni, C.F., 1998, Sea floor topographic map and perspective-view imagery of Quadrangles 1–18, Stellwagen Bank National Marine Sanctuary off Boston, Massachusetts: U.S. Geological Survey Open-File Report 98–138, 1 CD-ROM. (Also available online at http://pubs.usgs.gov/of/of98-138/) 5. Valentine, P.C., Baker, J.L., Unger, T.S., and Roworth, E.T., 1997, Sea floor topography of Quadrangle 1 in the Stellwagen Bank National Marine Sanctuary off Boston, Massachusetts: U.S. Geological Survey Open-File Report 97–502, scale 1:25,000. 6. Valentine, P.C., Unger, T.S., Baker, J.L., and Roworth, E.T., 1997, Sea floor topography of Quadrangle 2 in the Stellwagen Bank National Marine Sanctuary off Boston, Massachusetts: U.S. Geological Survey Open-File Report 97–503, scale 1:25,000. 7. Valentine, P.C., Baker, J.L., Unger, T.S., and Roworth, E.T., 1997, Sea floor topography of Quadrangle 3 in the Stellwagen Bank National Marine Sanctuary off Boston, Massachusetts: U.S. Geological Survey Open-File Report 97–504, scale 1:25,000. 8. Valentine, P.C., Unger, T.S., Baker, J.L., and Roworth, E.T., 1997, Sea floor topography of Quadrangle 4 in the Stellwagen Bank National Marine Sanctuary off Boston, Massachusetts: U.S. Geological Survey Open-File Report 97–505, scale 1:25,000. 9. Valentine, P.C., Baker, J.L., Unger, T.S., and Roworth, E.T., 1997, Sea floor topography of Quadrangle 5 in the Stellwagen Bank National Marine Sanctuary off Boston, Massachusetts: U.S. Geological Survey Open-File Report 97–506, scale 1:25,000. 10. Valentine, P.C., Unger, T.S., Baker, J.L., and Roworth, E.T., 1997, Sea floor topography of Quadrangle 6 in the Stellwagen Bank National Marine Sanctuary off Boston, Massachusetts: U.S. Geological Survey Open-File Report 97–507, scale 1:25,000. 11. Valentine, P.C., Baker, J.L., Unger, T.S., and Roworth, E.T., 1997, Sea floor topography of Quadrangle 7 in the Stellwagen Bank National Marine Sanctuary off Boston, Massachusetts: U.S. Geological Survey Open-File Report 97–508, scale 1:25,000. 12. Valentine, P.C., Unger, T.S., Baker, J.L., and Roworth, E.T., 1997, Sea floor topography of Quadrangle 8 in the Stellwagen Bank National Marine Sanctuary off Boston, Massachusetts: U.S. Geological Survey Open-File Report 97–509, scale 1:25,000. 13. Valentine, P.C., Baker, J.L., Unger, T.S., and Roworth, E.T., 1997, Sea floor topography of Quadrangle 9 in the Stellwagen Bank National Marine Sanctuary off Boston, Massachusetts: U.S. Geological Survey Open-File Report 97–682, scale 1:25,000. 14. Valentine, P.C., Unger, T.S., Baker, J.L., and Roworth, E.T., 1997, Sea floor topography of Quadrangle 10 in the Stellwagen Bank National Marine Sanctuary off Boston, Massachusetts: U.S. Geological Survey Open-File Report 97–683, scale 1:25,000. 15. Valentine, P.C., Baker, J.L., Unger, T.S., and Roworth, E.T., 1997, Sea floor topography of Quadrangle 11 in the Stellwagen Bank National Marine Sanctuary off Boston, Massachusetts: U.S. Geological Survey Open-File Report 97–684, scale 1:25,000. 16. Valentine, P.C., Unger, T.S., Baker, J.L., and Roworth, E.T., 1997, Sea floor topography of Quadrangle 12 in the Stellwagen Bank National Marine Sanctuary off Boston, Massachusetts: U.S. Geological Survey Open-File Report 97–685, scale 1:25,000. 17. Valentine, P.C., Baker, J.L., Unger, T.S., and Roworth, E.T., 1997, Sea floor topography of Quadrangle 13 in the Stellwagen Bank National Marine Sanctuary off Boston, Massachusetts: U.S. Geological Survey Open-File Report 97–726, scale 1:25,000. 18. Valentine, P.C., Unger, T.S., Baker, J.L., and Roworth, E.T., 1997, Sea floor topography of Quadrangle 14 in the Stellwagen Bank National Marine Sanctuary off Boston, Massachusetts: U.S. Geological Survey Open-File Report 97–727, scale 1:25,000. 19. Valentine, P.C., Baker, J.L., Unger, T.S., and Roworth, E.T., 1997, Sea floor topography of Quadrangle 15 in the Stellwagen Bank National Marine Sanctuary off Boston, Massachusetts: U.S. Geological Survey Open-File Report 97–728, scale 1:25,000. 20. Valentine, P.C., Unger, T.S., Baker, J.L., and Roworth, E.T., 1997, Sea floor topography of Quadrangle 16 in the Stellwagen Bank National Marine Sanctuary off Boston, Massachusetts: U.S. Geological Survey Open-File Report 97–729, scale 1:25,000. 21. Valentine, P.C., Baker, J.L., Unger, T.S., and Roworth, E.T., 1997, Sea floor topography of Quadrangle 17 in the Stellwagen Bank National Marine Sanctuary off Boston, Massachusetts: U.S. Geological Survey Open-File Report 97–730, scale 1:25,000. 22. Valentine, P.C., Unger, T.S., Baker, J.L., and Roworth, E.T., 1997, Sea floor topography of Quadrangle 18 in the Stellwagen Bank National Marine Sanctuary off Boston, Massachusetts: U.S. Geological Survey Open-File Report 97–731, scale 1:25,000. Stellwagen Bank National Marine Sanctuary—Sun-Illuminated Sea Floor Topographic Imagery 23. Valentine, P.C., Unger, T.S., Baker, J.L., and Polloni, C.F., 2000, Sun-illuminated sea floor topographic maps and perspective-view imagery of Quadrangles 1–18, Stellwagen Bank National Marine Sanctuary off Boston, Massachusetts: U.S. Geological Survey Open-File Report 99–363, 1 CD-ROM. (Also available online at http://pubs.usgs.gov/of/of99-363/) 24. Valentine, P.C., Baker, J.L., and Unger, T.S., 2000, Sun-illuminated sea floor topography of Quadrangle 1 in the Stellwagen Bank National Marine Sanctuary off Boston, Massachusetts: U.S. Geological Survey Geologic Investigations Series Map I–2701, scale 1:25,000. 25. Valentine, P.C., Unger, T.S., and Baker, J.L., 1999, Sun-illuminated sea floor topography of Quadrangle 2 in the Stellwagen Bank National Marine Sanctuary off Boston, Massachusetts: U.S. Geological Survey Geologic Investigations Series Map I–2702, scale 1:25,000. 26. Valentine, P.C., Baker, J.L., and Unger, T.S., 1999, Sun-illuminated sea floor topography of Quadrangle 3 in the Stellwagen Bank National Marine Sanctuary off Boston, Massachusetts: U.S. Geological Survey Geologic Investigations Series Map I–2703, scale 1:25,000. 27. Valentine, P.C., Unger, T.S., and Baker, J.L., 2000, Sun-illuminated sea floor topography of Quadrangle 4 in the Stellwagen Bank National Marine Sanctuary off Boston, Massachusetts: U.S. Geological Survey Geologic Investigations Series Map I–2704, scale 1:25,000. 28. Valentine, P.C., Baker, J.L., and Unger, T.S., 1999, Sun-illuminated sea floor topography of Quadrangle 5 in the Stellwagen Bank National Marine Sanctuary off Boston, Massachusetts: U.S. Geological Survey Geologic Investigations Series Map I–2705, scale 1:25,000. 29. Valentine, P.C., Unger, T.S., and Baker, J.L., 1999, Sun-illuminated sea floor topography of Quadrangle 6 in the Stellwagen Bank National Marine Sanctuary off Boston, Massachusetts: U.S. Geological Survey Geologic Investigations Series Map I–2706, scale 1:25,000. 30. Valentine, P.C., Baker, J.L., and Unger, T.S., 1999, Sun-illuminated sea floor topography of Quadrangle 7 in the Stellwagen Bank National Marine Sanctuary off Boston, Massachusetts: U.S. Geological Survey Geologic Investigations Series Map I–2707, scale 1:25,000. 31. Valentine, P.C., Unger, T.S., and Baker, J.L., 1999, Sun-illuminated sea floor topography of Quadrangle 8 in the Stellwagen Bank National Marine Sanctuary off Boston, Massachusetts: U.S. Geological Survey Geologic Investigations Series Map I–2708, scale 1:25,000. 32. Valentine, P.C., Baker, J.L., and Unger, T.S., 2000, Sun-illuminated sea floor topography of Quadrangle 9 in the Stellwagen Bank National Marine Sanctuary off Boston, Massachusetts: U.S. Geological Survey Geologic Investigations Series Map I–2709, scale 1:25,000. 33. Valentine, P.C., Unger, T.S., and Baker, J.L., 2000, Sun-illuminated sea floor topography of Quadrangle 10 in the Stellwagen Bank National Marine Sanctuary off Boston, Massachusetts: U.S. Geological Survey Geologic Investigations Series Map I–2710, scale 1:25,000. 34. Valentine, P.C., Baker, J.L., and Unger, T.S., 2000, Sun-illuminated sea floor topography of Quadrangle 11 in the Stellwagen Bank National Marine Sanctuary off Boston, Massachusetts: U.S. Geological Survey Geologic Investigations Series Map I–2711, scale 1:25,000. 35. Valentine, P.C., Unger, T.S., and Baker, J.L., 2000, Sun-illuminated sea floor topography of Quadrangle 12 in the Stellwagen Bank National Marine Sanctuary off Boston, Massachusetts: U.S. Geological Survey Geologic Investigations Series Map I–2712, scale 1:25,000. 36. Valentine, P.C., Baker, J.L., and Unger, T.S., 2001, Sun-illuminated sea floor topography of Quadrangle 13 in the Stellwagen Bank National Marine Sanctuary off Boston, Massachusetts: U.S. Geological Survey Geologic Investigations Series Map I–2713, scale 1:25,000. 37. Valentine, P.C., Unger, T.S., and Baker, J.L., 2001, Sun-illuminated sea floor topography of Quadrangle 14 in the Stellwagen Bank National Marine Sanctuary off Boston, Massachusetts: U.S. Geological Survey Geologic Investigations Series Map I–2714, scale 1:25,000. 38. Valentine, P.C., Baker, J.L., and Unger, T.S., 2001, Sun-illuminated sea floor topography of Quadrangle 15 in the Stellwagen Bank National Marine Sanctuary off Boston, Massachusetts: U.S. Geological Survey Geologic Investigations Series Map I–2715, scale 1:25,000. 39. Valentine, P.C., Unger, T.S., and Baker, J.L., 2001, Sun-illuminated sea floor topography of Quadrangle 16 in the Stellwagen Bank National Marine Sanctuary off Boston, Massachusetts: U.S. Geological Survey Geologic Investigations Series Map I–2716, scale 1:25,000. 40. Valentine, P.C., Baker, J.L., and Unger, T.S., 2001, Sun-illuminated sea floor topography of Quadrangle 17 in the Stellwagen Bank National Marine Sanctuary off Boston, Massachusetts: U.S. Geological Survey Geologic Investigations Series Map I–2717, scale 1:25,000. 41. Valentine, P.C., Unger, T.S., and Baker, J.L., 2001, Sun-illuminated sea floor topography of Quadrangle 18 in the Stellwagen Bank National Marine Sanctuary off Boston, Massachusetts: U.S. Geological Survey Geologic Investigations Series Map I–2718, scale 1:25,000. Stellwagen Bank National Marine Sanctuary—Sun-Illuminated Sea Floor Topographic Imagery and Backscatter Intensity 42. Valentine, P.C., Middleton, T.J., and Fuller, S.J., 2001, Sea floor maps showing topography, sun-illuminated topography, and backscatter intensity of the Stellwagen Bank National Marine Sanctuary region off Boston, Massachusetts: U.S. Geological Survey Open-File Report 00–410, 1 CD-ROM. (Also available online at http://pubs.usgs.gov/of/of00-410/) (Superseded by maps I–2676–A, –B, and –C; see publications 43–45 in this list.) 43. Valentine, P.C., Baker, J.L., and Unger, T.S., 2003, Sea floor topography of the Stellwagen Bank National Marine Sanctuary off Boston, Massachusetts: U.S. Geological Survey Geologic Investigations Series Map I–2676–A, scale 1:60,000. 44. Valentine, P.C., Unger, T.S., and Baker, J.L., 2003, Sun-illuminated sea floor topography of the Stellwagen Bank National Marine Sanctuary off Boston, Massachusetts: U.S. Geological Survey Geologic Investigations Series Map I–2676–B, scale 1:60,000. 45. Valentine, P.C., Unger, T.S., and Baker, J.L., 2003, Backscatter intensity and sun-illuminated sea floor topography of the Stellwagen Bank National Marine Sanctuary off Boston, Massachusetts: U.S. Geological Survey Geologic Investigations Series Map I–2676–C, scale 1:60,000. Stellwagen Bank National Marine Sanctuary—Seabed Ruggedness and Distribution of Boulder Ridges and Bedrock Outcrops 46. Valentine, P.C., Fuller, S.J., and Scully, L.A. [2004], Terrain ruggedness analysis and distribution of boulder ridges and bedrock outcrops in the Stellwagen Bank National Marine Sanctuary region—seabed ruggedness: U.S. Geological Survey poster available online at http://woodshole.er.usgs.gov/project-pages/stellwagen/posters/rugged.html (Downloaded July 27, 2005.) 47. Valentine, P.C., Scully, L.A., and Fuller, S.J. [2004], Terrain ruggedness analysis and distribution of boulder ridges and bedrock outcrops in the Stellwagen Bank National Marine Sanctuary region—boulder ridges and bedrock outcrops: U.S. Geological Survey poster available online at http://woodshole.er.usgs.gov/project-pages/stellwagen/posters/ridges.html (Downloaded July 27, 2005.) Terrain Ruggedness Index (TRI) 48. Riley, S.J., DeGloria, S.D, and Elliott, R., 1999, A terrain ruggedness index that quantifies topographic heterogeneity: Intermountain Journal of Sciences, v. 5, no. 1-4, p. 23–27.
|
|||||||||||||||||||||||||||||||
| |||||||||||||||||||||||||||||||