 |
bathymap
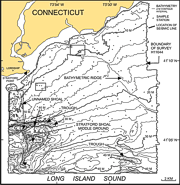
- Bathymetric map of NOAA survey H11044. Depths are in meters
and represent mean lower low water level. Sediment sampling and bottom
photography stations within the study area are also shown. Detailed views of the
sidescan-sonar mosaic identified by boxes A, B, and C is available
here. Location of
seismic line
is also
noted. |
| |
|
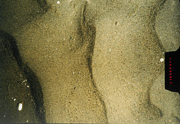 |
cbtransport - Bottom photograph showing an example of a
sedimentary environment characterized by coarse bedload
transport. Note current ripples. Bottom photo is
from Niantic Bay in Long Island Sound (Poppe and others,
2000c). |
| |
|
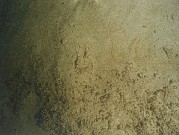 |
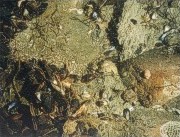
deposition - Bottom photograph showing an example of a sedimentary
environment characterized by deposition. Note the muddy sediment and abundant
polychaete and amphipod tubes. Bottom photo is from Niantic Bay in Long Island
Sound (Poppe and others, 2000c). |
| |
|
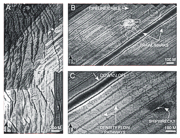 |
detailedsss - Detailed views of the sidescan-sonar image (location
map). A.) Sand waves on unnamed shoal south of Lordship. B.) Circular trawl
marks and pipeline or cable. C.) Low backscatter bands probably representing
density-flow pathways. Object on right side of image is about 60 m long and is
most likely an uncharted shipwreck surrounded by a halo of fine-grained
sediment. |
| |
|
 |
erosion - Bottom photograph showing an example of a sedimentary
environment characterized by erosion or nondeposition. Note the gravelly
sediment and sessile fauna. Bottom photo is from Niantic Bay in Long Island
Sound (Poppe and others, 2000c). |
| |
|
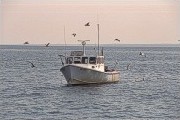 |
fishingc - Lobster boat pulling traps in Long Island
Sound. |
| |
|
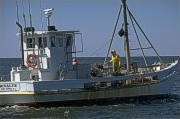 |
fishingd - Clam trawler BIVALVE at sea in north-central
Long Island Sound. |
| |
|
 |
interpretation - Interpretation of
sidescan-sonar mosaic NOAA survey H11044.
The degree of backscatter is mapped, as are areas of natural features (such as
sand waves and rocks) and areas with anthropogenic features (such as trawl
marks, concentrations of lobster pots, and pipelines or cables). |
| |
|
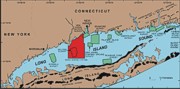 |
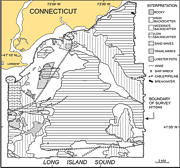
locationmap - Map showing location of
National Oceanic and Atmospheric
Administration (NOAA) survey H11044 (red polygon). Also shown are major
onshore moraines, and sites of other surveys in this series: Norwalk--Twichell
and others (1997); Milford--Twichell and others (1998); New Haven Harbor and New
Haven Dumping Ground--Poppe and others (2001); Branford--Poppe and others
(2004); Roanoke Point--Poppe and others (1999a); Falkner Island--Poppe and
others (1999b); Hammonasset--Poppe and others (1997); Niantic Bay--Poppe and
others (1998b); New London--Zajac and others (2003); Fishers Island Sound--Poppe
and others (1998a). |
| |
|
 |
mosaic - Sidescan-sonar mosaic of NOAA survey H11044. Light areas
represent high backscatter (generally coarser-grained sediments) and dark areas
represent low backscatter (generally finer-grained sediments). |
| |
|
 |
rudechelsea - Starboard-side view of the National
Oceanic and Atmospheric Administration (NOAA) Research
Vessel RUDE at dock in Chelsea, Massachusetts. |
| |
|
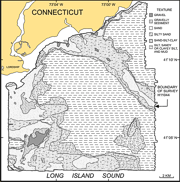 |
seddist - Map showing the surficial sediment distribution within
NOAA
survey H11044, based on
sidescan-sonar mosaic, bathymetry, and texture
analyses of sediment samples from the stations shown in the
bathymetry
map. |
| |
|
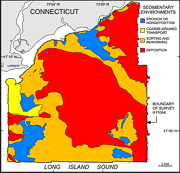 |
sedenv - Map showing the sedimentary environment distribution within
NOAA survey H11044, based on
sidescan-sonar mosaic, bathymetry, texture
analyses of sediment samples and
surficial sediment map. |
| |
|
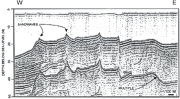 |
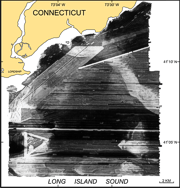
seismic - Seismic line crossing an area of sand waves south of Stratford
Point (location
map). The two westernmost sand waves have west-facing lee sides and the four
easternmost sand waves have east-facing lee sides. Vertical exaggeration: 32x. |
| |
|
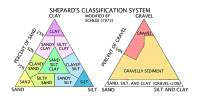 |
shepfig - Sediment classification scheme from Shepard
(1954) as modified by Schlee (1973). |
| |
|
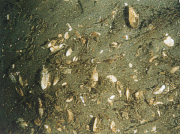 |
sortrewk - Bottom photograph showing an example of a
sedimentary environment characterized by sorting or
reworking. Note the sandy muddy sediment and abundant shell
debris. Bottom photo is from Niantic Bay in Long Island
Sound (Poppe and others, 2000c). |
| |
|
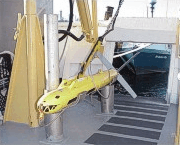 |
towfish - Edgetech (EG&G) 272T sidescan sonar tow fish
used aboard the RUDE for data acquisition during NOAA survey
H11043. |
| |
|
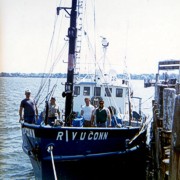 |
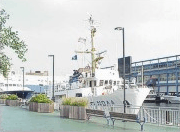
UCONN - R/V UCONN at dock with members of the crew and scientific
party. |