 |
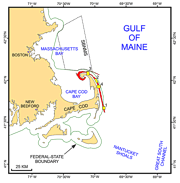
Figure 1: Index map of Cape Cod and the Islands showing the multibeam coverage (red polygon). Yellow polygons, which show locations of exposed glaciodeltaic strata identified as part of this study, are labeled chronologically and represent deposits of the Barnstable (1), Wellfleet (2), Truro (3), and Eastham (4) outwash plains. The map also shows the location and extent of the Stellwagen Bank National Marine Sanctuary (SBNMS).
|
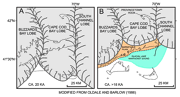 |
Figure 2: Regional paleogeographic maps of Cape Cod and the Islands. A) Extent of the Laurentide ice sheet about 20 ka. B) Extent of the Laurentide ice sheet just prior to 18 ka. Maps modified from Oldale and Barlow (1986).
|
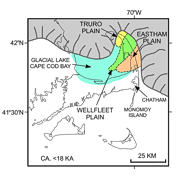 |
Figure 3: Regional paleogeographic map of Cape Cod and the Islands soon after 18 ka. Map shows the extent of the Laurentide ice sheet, Glacial Lake Cape Cod Bay, and the Wellfleet, Truro, and Eastham outwash plains. Map modified from Uchupi and others (1996).
|
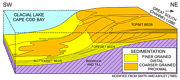 |
Figure 4: Schematic diagram of deltaic deposits in the Eastham Plain on outer Cape Cod. Diagram shows deltaic deposits prograding southwestward into Glacial Lake Cape Cod Bay from the South. Channel lobe.
|
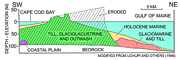 |
Figure 5: Schematic geologic cross section of the Eastham Plain on outer Cape Cod. Diagram, which is modified from Uchupi and others (1996), shows the extent of erosional modification by marine processes during the Holocene sea-level rise and framework for exposed gaciodeltaic sediments.
|
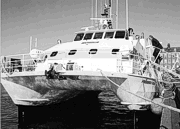 |
Figure 6: Photograph of the twin-hulled Canadian Coast Guard vessel FREDERICK
G. CREED that was used to collect the multibeam echosounder data off outer Cape Cod.
|
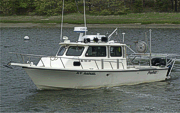 |
Figure 7: Image shows a port-side view of the USGS research vessel
R/V RAFAEL that was used to collect bottom photography and sediment samples off outer Cape Cod.
|
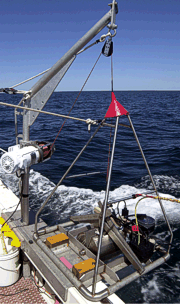 |
Figure 8: View of the modified Van Veen grab equipped with still and video photographic systems.
|
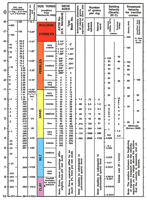 |
Figure 9: Correlation chart showing the relationships between phi sizes, millimeter diameters, size classifications (Wentworth, 1922), and ASTM and Tyler sieve sizes. Chart also shows the corresponding intermediate diameters, grains per milligram, settling velocities, and threshold velocities for traction.
|
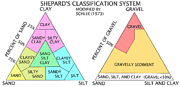 |
Figure 10: Sediment classification scheme from Shepard (1954), as modified by Schlee (1973).
|
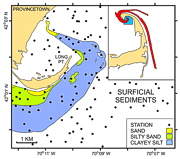 |
Figure 11: Map showing the distribution of surficial sediments off Long Point. Inset shows map location (blue polygon) within survey area (red polygon).
|
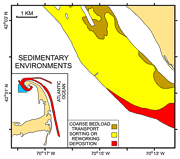 |
Figure 12: Map showing the distribution of sediment environments between Long and Race Points. Inset shows map location (blue polygon) within survey area (red polygon).
|
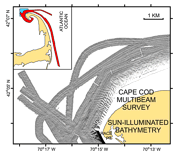 |
Figure 13: Sun-illuminated multibeam bathymetry from off northeastern Cape Cod. Image shows the large sandwave field associated with Race Point. Sandwaves gradually diminish in period and height eastward and offshore. Inset shows map location (blue polygon) within survey area (red polygon).
|
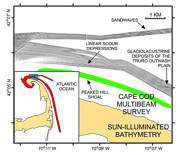 |
Figure 14: Sun-illuminated multibeam bathymetry from off northeastern Cape Cod. Image also shows locations of a field of sandwaves, linear scour depressions adjacent to Peaked Hill Shoal, and outcrops of fine-grained glaciolacustrine sediment. Inset shows map location (blue polygon) within survey area (red polygon).
|
 |
Figure 15: Section of the sun-illuminated multibeam bathymetry providing a detailed planar view of the outcropping fine-grained distal glaciolacustrine sediments that are part of the Truro outwash plain. Figure also shows location of station
CC122.
|
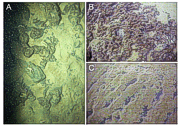 |
Figure 16: Bottom photography from station
CC122 showing glaciolacustrine sediments deposited as part of the Truro outwash plain. A) Still photograph of the glaciolacustrine sediments. B) Video frame showing honey-combed appearance of the glaciolacustrine sediments in the Truro plain. C) Video frame showing upper surface of the glaciolacustrine deposit partially covered by rippled sand.
|
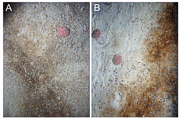 |
Figure 17: Bottom photographs showing sandy areas of the sea floor off Truro and Wellfleet. A) station
CC62; B) station
CC118. Note that gravel and brownish organic debris collect in the ripple troughs and that sand dollars congregate on the ripple crests. Sand dollars are approximately 7 cm in diameter.
|
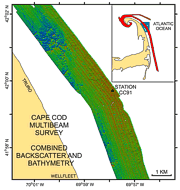 |
Figure 18: Pseudo-colored map of the sea floor off Truro showing combined bathymetry and backscatter intensity. Map shows a sand wave field, the general offshore trend toward higher backscatter and coarser sediments with this part of the study area, the gravelly area which probably consists of winnowed topset beds of the delta that built the Wellfleet outwash plain, and the location of station
CC91. Inset shows map location (blue polygon) within survey area (red polygon).
|
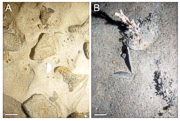 |
Figure 19: Bottom photographs showing gravelly areas of the sea floor off Truro and Wellfleet. A) station
CC69; B) station
CC91. Note the presence of sessile fauna that suggests lack of transport. See Figure 18 for location of station
CC91. White bars are approximately 10 cm.
|
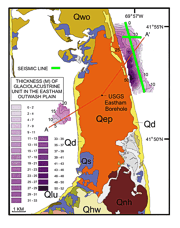 |
Figure 20: Map from Foster and Poppe (2003) showing the distribution and thickness of fine-grained glaciolacustrine deposits of the Eastham outwash plain on the Atlantic and Cape Cod Bay sides of the outer Cape. Green lines show the locations of seismic lines shown in Figure 21 and
22; red line shows the location of cross section A-A’ shown in
Figure 23. Qep: Eastham outwash plain; Qd: undifferentiated glacial drift; Qwo: Wellfleet outwash plain; Qhw: Harwich outwash plain; Qnh: Nauset Heights ice-contact deposits; Qs: swamp and marsh deposits; Qlu: Cape Cod Bay lake deposits.
|
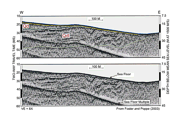 |
Figure 21: East-west seismic line from Foster and Poppe (2003). Seismic line shows the fine-grained glaciolacustrine deposits characterized by closely spaced internal reflectors within undifferentiated glacial drift, that this unit dips landward, and that it is truncated to the east by the Holocene transgression. See Figure 20 for location of seismic line.
|
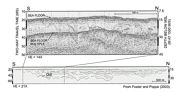 |
Figure 22: North-south seismic line from Foster and Poppe (2003) showing the lateral extent and that the glaciolacustrine deposit pinches out in these directions. See Figure 20 for location of seismic line.
|
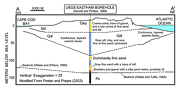 |
Figure 23: Interpretive cross section modified from Foster and Poppe (2003) based on the USGS Eastham borehole. Cross section shows the lateral distribution of fine-grained glaciolacustrine deposits and that they extend beneath the outer Cape. See
Figure 20 for location of cross section.
|
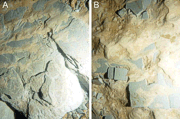 |
Figure 24: Bottom photographs showing distal fine-grained glaciolacustrine bottomset deposits from the Eastham outwash plain exposed at station
CC183. Note ledge in A and rip-up clasts in B. Long dimension of the sea-floor area shown is approximately 1 m.
|
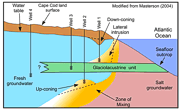 |
Figure 25: Schematic drawing modified from Masterson (2004) showing how fine-grained glaciolacustrine units can affect the position of the salt water/freshwater interface in well fields on Cape Cod. These units limit recharge causing saltwater intrusion and downconing of surface waters in wells drilled to above the fine-grained units (Well 1), upconing of salt water in wells drilled to below these units (Well 2), and poor flow rate in wells drilled into the glaciolacustrine sediments (Well 3).
|
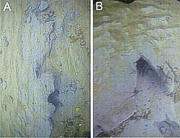 |
Figure 26: Video frames showing lobster burrows in the exposed muddy glaciolacustrine sediments of the Eastham Plain. A) station
CC182; B) station
CC183. Long dimension of the sea-floor area shown is approximately 1.3 m.
|
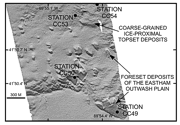 |
Figure 27: Sun-illuminated multibeam bathymetry showing deltaic deposits off North Eastham and Eastham, Cape Cod. Image shows winnowed ice-proximal topset deposits fringed by erosional outliers of finer grained deposits that are probably remnants of foreset beds. Figure also shows locations of stations
CC49,
CC50,
CC53, and
CC54.
|
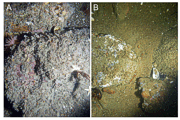 |
Figure 28: Bottom photographs showing winnowed more ice-proximal deltaic deposits of the Eastham outwash plain. A) Boulders with sessile fauna that includes an anemone at station
CC54. B) Gravel and coarse sand between boulders at station
CC53. Note lobster partly obscured by a boulder at lower left. Long dimension of the sea-floor area shown is approximately 1.6 m. See
Figure 27 for station locations.
|
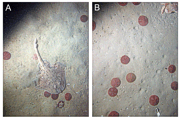 |
Figure 29: Bottom photographs showing top surfaces of erosional outliers of foreset beds associated with the Eastham outwash plain. Although draped by fine sand, preservation of these blocks indicates more cohesive sediments comprise the interiors. A) Skate and sand dollars on the undulating bottom at station
CC49. B) Tracks preserved in the finer grained sediments at station
CC50. Note crab partly visible in upper right. Long dimension of the sea-floor area shown is approximately 0.8 m. See
Figure 27 for station locations.
|
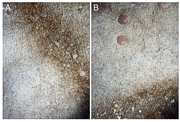 |
Figure 30: Bottom photographs showing representative views of the sea floor off Orleans. A) Gravel and organics collect in the ripple troughs at station
CC33. B) Gravel shell debris, and organics collect in the ripple troughs and sand dollars congregate on the ripple crests at station
CC35. Sand dollars are approximately 7 cm in diameter; long dimension of the sea-floor area shown is approximately 0.8 m.
|
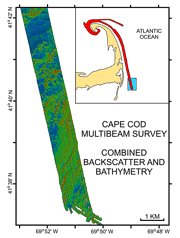 |
Figure 31: Pseudo-colored map of the sea floor off Chatham showing combined bathymetry and backscatter intensity. Predominantly sandy areas have low backscatter (blue); predominantly gravelly areas have moderate backscatter (green). Large sandwaves trend toward the northeast and have higher backscatter (red) and coarser sediments on their southeast-facing slopes. Inset shows map location (blue polygon) within survey area (red polygon).
|
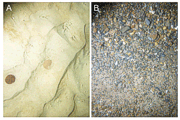 |
Figure 32: Bottom photographs showing representative views of the sea floor off Chatham. A) Current-rippled sand and sand dollars at station
CC12. Note the gravel poking through the surface in the ripple troughs, suggesting the surficial sand layer is thin. B) Gravel pavement at station
CC13. Sand dollars are approximately 7 cm in diameter; long dimension of the sea-floor area shown is approximately 0.9 m.
|
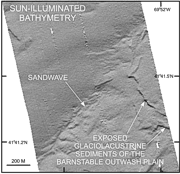 |
Figure 33: Section of the sun-illuminated multibeam bathymetry providing a detailed planar view of the outcropping fine-grained distal glaciolacustrine sediments that are interpreted to be part of the Barnstable outwash plain.
|


