USGS Coastal and Marine Geology Program
|
MethodsData Acquisition and Processing
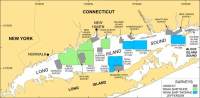
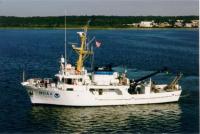
The bathymetry data and imagery contained in this report were produced from data collected during 2001, 2002, and 2003 as part of NOAA surveys H11043, H11044, and H11045, respectively, aboard the NOAA Ship RUDE (fig. 1, fig. 3). Together, these surveys cover approximately 524 km² of the sea floor in north-central Long Island Sound. The RUDE supports NOAA’s east-coast nautical charting mission, conducting hydrographic surveys primarily with sidescan sonar using a Klein towfish and single-beam bathymetry with an Odom Echotrac DF-3200 dual-frequency echosounder. The ship is also outfitted to acquire shallow-water multibeam bathymetry with a Reson 8125 system. The Reson multibeam system, which operates at 455 KHz with a 120 degree across-track swath and 240 beams along its swath, is used largely for development applications. These applications involve identifying targets and determining whether they pose a hazard to navigation.
The multibeam data for these surveys were acquired in XTF (extended Triton data format), recorded digitally through an ISIS data acquisition system, and processed using CARIS HIPS (Hydrographic Image Processing System) software for quality control and to incorporate sound velocity and tidal corrections. Sound velocity corrections were derived using frequent CTD (conductivity-temperature-depth) profiles. Tidal zone corrections were calculated from data acquired at primary and secondary tide-gauge stations using acoustic stilling-well gauges. Vertical datum is mean lower low water. The original multibeam data sets, which are in ASCII comma-delimited text, do not entirely cover the sea floor because line spacing during acquisition was such that areas of no data often are present between the ship’s tracks. Gridding and interpolation were conducted at the USGS’s Woods Hole Science Center to provide bathymetric data sets with more continuous coverage. First, all non-standardized records were assumed to be bad records and were removed. Subsequently, the PROJ.4 cartographic projections library was used to project the data, SwathEd software, produced by the Ocean Mapping Group at the University of New Brunswick, was used to create grids from the actual sounding data, and GMT (Generic Mapping Tools) was used to create interpolated grids of the bathymetry for each survey. Interpolation was achieved during GMT processing by running the data through a block median filter and using a surface generating algorithm with a tension of 0.5. The original reconnaissance grids for surveys H11043, H11044, and H11045 had resolutions of 1 m, 1.5 m, and 5 m, respectively. After interpolation, the data from survey H11043 was gridded to 3 m; surveys H11044 and H11045 were both gridded to 5 m. All interpolated data sets and imagery were cropped to remove edge effects from the processing and to remove areas where insufficient data were present to support the new grid resolution. A hill-shaded surface was generated from the interpolated grids using ArcGIS 9 (Arc catalog) with illumination from 270° (a direction parallel to most of the ship’s tracks to minimize artifacts) at 45° above the horizon. The geotiff imagery was created using the ArcView Image Conversion Georeferencing extension grid2image and a 10x vertical exaggeration was applied. The bathymetric grids and imagery released in this report should not be used for navigation. |