
Woods Hole Science Center
Title Page / Table of Contents / List of Figures / Introduction / Maps / Data Collection/Processing / Interpretation / Acknowledgments / Appendix 1 / Appendix 2 / Appendix 3 / Appendix 4
 |
 |
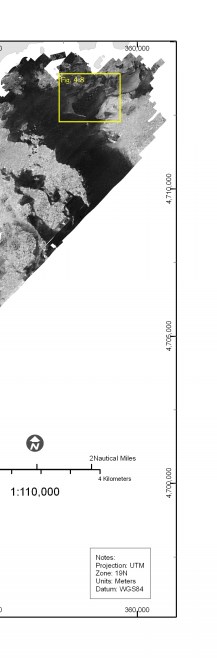 |
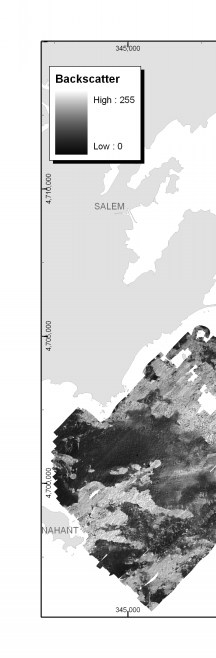
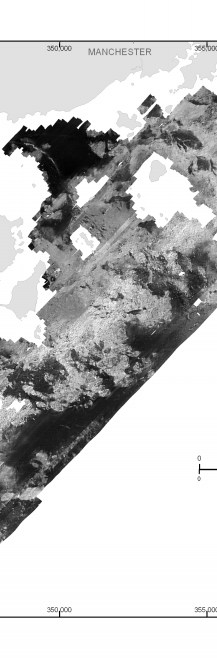
Figure 3.3. Map showing acoustic backscatter intensity offshore of northeastern Massachusetts between Nahant and Gloucester. Backscatter intensity, as recorded with sidescan sonar, is an acoustic measure of the hardness and roughness of the seafloor. In general, higher values (light tones) represent rock, gravel and coarse sand. Lower values (dark tones) generally represent fine sand and muddy sediment. Yellow box (upper right) indicates the location of Figure 4.8. | ||


