Skip USGS links group
U.S. Geological Survey - science for a changing world
CZM logo with link to CZM home page

Woods Hole Science Center

End of USGS links group
High-Resolution Geologic Mapping of the Inner Continental Shelf: Nahant to Gloucester, Massachusetts

Title Page / Table of Contents / List of Figures / Introduction / Maps / Data Collection/Processing / Interpretation / Acknowledgments / Appendix 1 / Appendix 2 / Appendix 3 / Appendix 4


Fig. 4.10. Graph depicting the mean grain size of sediment samples versus water depth in the survey area. Fig. 4.10. Graph depicting the mean grain size of sediment samples versus water depth in the survey area. Fig. 4.10. Graph depicting the mean grain size of sediment samples versus water depth in the survey area.

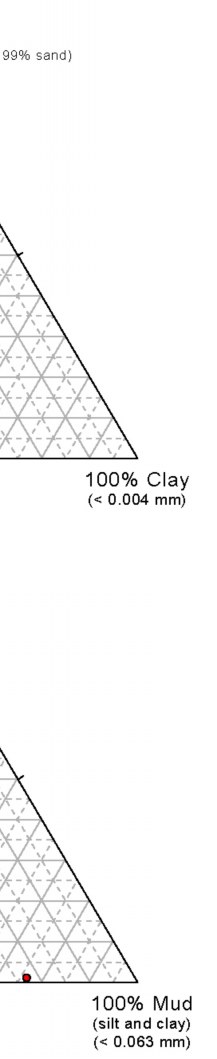
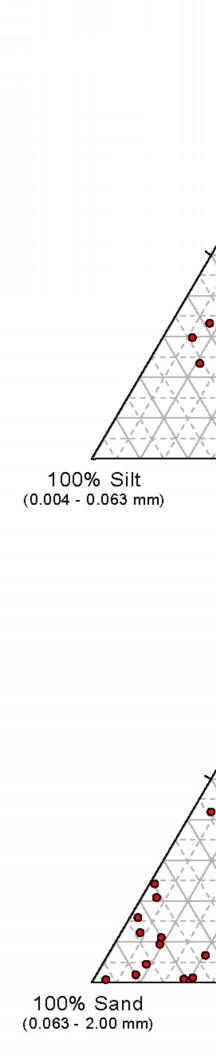
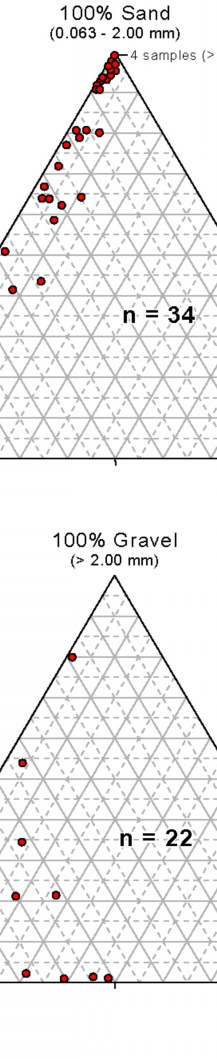
Figure 4.10. Ternary diagrams depicting the texture of surficial sediment collected in grab samples. The apexes of the diagrams represent 100% of the labeled textural component (i.e., gravel, sand, silt, and or clay). The upper diagram depicts 34 samples that lack gravel; the lower diagram depicts 22 samples that contain at least 0.5% gravel. See table 4.2 for additional information on these samples.


Skip Footer Information
Skip Navigation

Accessibility FOIA Privacy Policies and Notices

U.S. Department of the Interior | U.S. Geological Survey | Coastal and Marine Geology

URL: cmgds.marine.usgs.gov/publications/of2005-1293/html/imagepages/fig4_10.html
Page Contact Information: CMGDS Team
Page Last Modified: Wednesday, 06-Dec-2017 12:46:01 EST