 |
Figure 1. Map of Narragansett Bay with study areas shown in red. Rectangles in study areas show the locations of figure 4 (in East Passage), figure 7 (southern rectangle in West Passage), and figure 8 (northern rectangle in West Passage). |
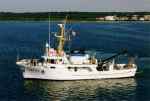 |
Figure 2. Photo of NOAA Ship RUDE (taken by NOAA). |
 |
Figure 3. Bathymetry map of study areas. Depth is in meters and represents mean lower low water. |
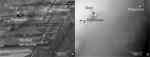 |
Figure 4. A. Sidescan sonar image of mottled backscatter, pockmarks, and a rock. B. Bathymetry image of the same area showing irregular bottom corresponding to mottled backscatter and scour to the southwest of the rock. Location of area shown in figure 1. |
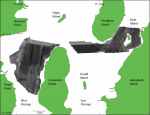 |
Figure 5. Sidescan sonar image of study areas. Dark tones indicate low backscatter and generally finer grained sediment; light tones indicate high backscatter and generally coarser grained sediment. Tonal changes are generally gradual, although abrupt changes occur in areas, such as the northern edge of the West Passage study area, due to artifacts of the processing. |
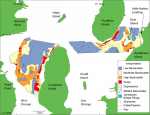 |
Figure 6. Interpretation map of sidescan sonar and bathymetry data. |
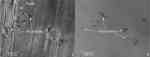 |
Figure 7. A. Sidescan sonar image of circular depressions (pockmarks) B. Bathymetry image of same area. Location of area shown in figure 1. |
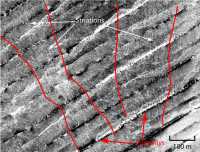 |
Figure 8. Sidescan sonar image of erosional pathways in West Passage. Location of area shown in figure 1. |
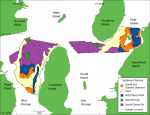 |
Figure 9. Map showing sample locations and distribution of surficial sediments. Map boundaries interpreted from sediment samples, backscatter, and bathymetry data. |
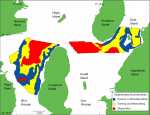 |
Figure 10. Map showing distribution of sedimentary environments. Interpretation of map units is based on backscatter, bathymetry and sediment sample data. |


