
|
The study area (fig. 1) can be divided into four distinct reaches (fig. 2) on the basis of erosion rate, which is consistent with previous work. The simple and weighted least squares regression techniques yield generally similar shoreline rates of change. The weighted least squares regression results are used here. Average rates of change are shown in table 2. The coast in Reach A, from Punta Higüero to the north end of the Balneario de Rincón, is stable to slowly eroding and characterized by a long-term (70 years) average erosion rate of -0.2 ± 0.1 m/yr (fig. 4). In Reach B, from the Balneario de Rincón to 500 m south of the mouth of Quebrada los Ramos (approximately where the Rincón of the Seas resort fronts the ocean), the coast has a long-term average erosion rate of -1.1 ± 0.3 m/yr (fig. 5). Reach C extends from 500 m south of the mouth of Quebrada los Ramos to Córcega (a point on the beach seaward of where Carretera 429 joins Carretera 115). Here, the long-term erosion rate averages -0.4 ± 0.2 m/yr (fig. 6). Reach D, from Córcega to Punta Cadena, is characterized by long-term average shoreline change rates of -0.2 ± 0.2 m/yr (fig. 7).
End-point shoreline change rates were calculated for the two GPS field surveys done in 1994 and 2006 (table 2). These surveys are the most accurate available and are based on data obtained while actually walking the shoreline rather than interpretation of remotely sensed data. The average rates of change over the past 12 years are: Reach A -0.3 ± 0.4 m/yr (fig. 8), Reach B -1.0 ± 0.4 m/yr (fig. 9), Reach C -0.7 ± 0.4 m/yr (fig. 10), and Reach D -0.3 ± 0.4 m/yr (fig. 11). |
Click on figures for larger images.
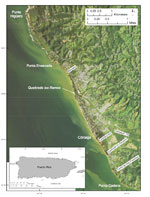 |
Figure 1. Map showing location of the study area in Rincón, Puerto Rico. (Image is a 2004 orthophoto.)
|
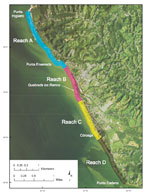 |
Figure 2. Map showing locations of four distinct shoreline reaches in the Rincón , Puerto Rico study area.
|
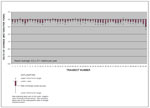 |
Figure 4. Graph showing alongshore spatial distribution of long-term (70 years from 1936-2006) rates of shoreline change for Reach A, Rincón, Puerto Rico study area
|
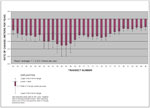 |
Figure 5. Graph showing alongshore spatial distribution of long-term (70 years from 1936-2006) rates of shoreline change for Reach B, Rincón, Puerto Rico study area.
|
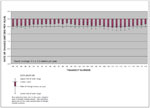 |
Figure 6. Graph showing alongshore spatial distribution of long-term (70 years from 1936-2006) rates of shoreline change for Reach C, Rincón, Puerto Rico study area.
|
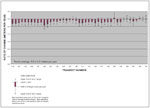 |
Figure 7. Graph showing alongshore spatial distribution of long-term (70 years from 1936-2006) rates of shoreline change for Reach D, Rincón, Puerto Rico study area.
|
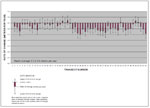 |
Figure 8. Graph showing alongshore spatial distribution of short-term (12 years from 1994-2006) rates of shoreline change for Reach A, Rincón, Puerto Rico study area.
|
 |
Figure 9. Graph showing alongshore spatial distribution of short-term (12 years from 1994-2006) rates of shoreline change for Reach B, Rincón, Puerto Rico study area.
|
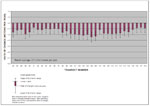 |
Figure 10. Graph showing alongshore spatial distribution of short-term (12 years from 1994-2006) rates of shoreline change for Reach C, Rincón, Puerto Rico study area.
|
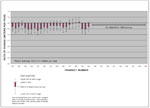 |
Figure 11. Graph showing alongshore spatial distribution of short-term (12 years from 1994-2006) rates of shoreline change for Reach D, Rincón, Puerto Rico study area.
|
|
