|
Page C. Valentine, editor
Map E. — Sea Floor Slope and Sun-Illuminated Topography in the Stellwagen Bank National Marine Sanctuary Region
By
Page C. Valentine, Sarah J. Fuller, and Lian A. Scully
2005
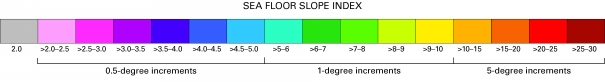 |
Sea floor slope index. Colors represent the maximum rate of change in elevation, shown as slope angle in degrees, between a central area (a 13- x 13-m pixel) and the eight pixels that surround it (total area analyzed is three pixels by three pixels, or 39 x 39 m in size). For example, on the map yellow represents central pixels having a maximum rate of change in elevation of >9 to 10 degrees with respect to their surrounding eight-pixel areas. Note the slope-change increments in the color index vary from 0.5 degree to 1 degree to 5 degrees. A filter was applied to the slope image to smooth the boundaries between the mapped intervals. The filter calculated the mean of the slope value of each pixel and its eight neighboring pixels in a three-pixel by three-pixel grid that measures 39 x 39 m. Areas of slope were calculated using this filtered image; see table 1.
|
|
