
USGS Development Version of ROMS
Solution to Test Case 3: Lake Signell
ROMS v2.0 Date: September 3, 2002 Modeller: John C. Warner (jcwarner@usgs.gov), USGS Woods Hole Field Center 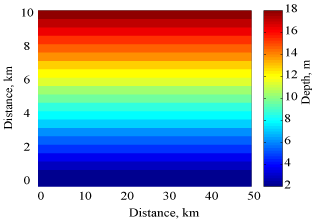 Figure 1. Model bathymetry. Model bathymetry has a sloping bottom as shown in figure 1. Simulations were conducted for 3.0 days. For this simulation, the bottom orbital velocities, wave period, and direction were obtained from a steady-state solution of the model SWAN. For the hydrodynamic simulation, the wave field results from SWAN were increased from 0 to their maximum values with a hyperbolic tangent function that reached maximum value at 10 hours. The surface stress was held constant until a total of 40 hours have elapsed, when the stress was decreased hyperbolically for 10 hours. The simulation continued until all sediment had settled from the water column. 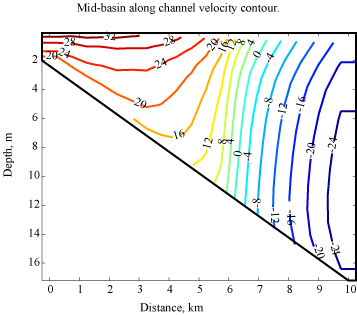 Figure 2. Along channel velocity contours (cm/s) at x = 25 km. Positive velocity is out of the page (downwind flow), negative into the page (upwind flow). 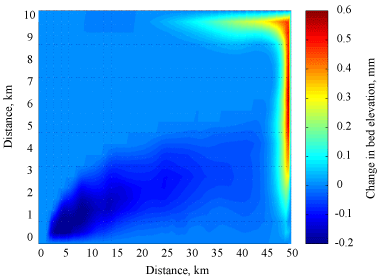 Figure 3. Plan view of final bathymetric change.
|

 U.S. Department of the Interior |
U.S. Geological Survey
U.S. Department of the Interior |
U.S. Geological Survey
URL: woodshole.er.usgs.gov/project-pages/sediment-transport/John_test3.htm
Page Contact Information: WHSC Webmaster
This page last modified on Monday, 05-Dec-2016 16:31:19 EST