USGS Coastal and Marine Geology Program
|
Introduction
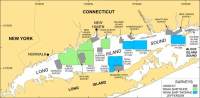
The U.S. Geological Survey (USGS), in cooperation with the National Oceanic and Atmospheric Administration (NOAA) and the Connecticut Department of Environmental Protection (CT DEP), has produced detailed maps of the sea floor in Long Island Sound, a major East Coast estuary surrounded by the most densely populated region of the United States (fig. 1). The current phase of this cooperative research program is directed toward studies of sea-floor topography and its effect on the distributions of sedimentary environments and benthic communities. Because anthropogenic wastes, toxic chemicals, and changes in land-use patterns resulting from residential, commercial, and recreational development have stressed the environment of the Sound, causing degradation and potential loss of benthic habitats (Koppelman and others, 1976; Long Island Sound Study, 1994), detailed maps of the sea floor are needed to help evaluate the extent of adverse impacts and to help manage resources wisely in the future.
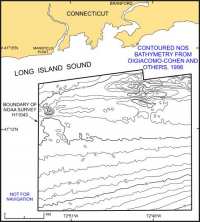
Two digital regional bathymetric data sets are available for the Long Island Sound basin. The first is a 1-m contour coverage that was produced from National Ocean Service bathymetric topographic sheets and bathymetric fishing maps by Applied Geographics, Inc., using table digitizing and scanning/vectorization (DiGiacomo-Cohen and others, 1998) (fig. 2). The second data set is a 3 arc second topographic grid constructed for use in circulation and modeling studies (Signell and Farris, 1998; Signell and others, 2000). This data set was produced from data used to construct the contour coverage described above supplemented by other more limited bathymetry data. Cell size in this 3 arc second grid varies, but is approximately 92 m north-south by 68.8-70.9 m east-west, depending on the latitude. Unfortunately, while good for general overviews, neither of these regional bathymetric data sets contains enough detail to meet current research and management requirements. In this report, we present data from reconnaissance acoustic bathymetric surveys, primarily single-beam and shallow-water multibeam echosoundings, which have been interpolated and regridded into complete-coverage data sets and images of the sea floor (fig. 1). These bathymetric data sets serve many purposes, including:
These data sets can also serve as base maps for subsequent sedimentological, geochemical, and biological observations, because precise information on environmental setting is important for selection of sampling sites and for accurate interpretation of point measurements. |