
|
Appendix 2 - Sediment Texture
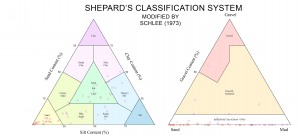 |
Figure A2.1. Texture of surficial sediment collected in grab samples shown on ternary diagrams. The stations are keyed to the map units (see fig. 4.21). Texture of the rough sea-floor zones is not represented, as samples could not be collected in areas of boulders or gravel pavement. . Click on figure for larger image.
|
Sediment texture analyses for all samples obtained in this study are presented in a summary table (below) and in table A2.1. The location of these samples and the texture data is also available in the Geographic Information System (see Appendix 1) where they can be viewed with other geologic data. See Figure 3.7 for the location of sediment samples superimposed on a map of backscatter intensity. Photographs of the sea floor obtained at these stations and at sites where grab samples could not be obtained are available in Appendix 3.
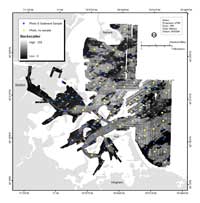 |
Figure 3.7. Map showing location of bottom samples on a map of acoustic backscatter intensity from sidescan sonar. Each numbered circle indicates a station where photographs, video, and/or samples were collected. See map sheet 5 for figure at a scale of 1:60,000.
Click on figure for larger image.
|
See Poppe and others (2000) for a description of the procedures for sediment texture analysis. Hastings and others (2000) provide a data dictionary describing the column headings in the Excel spreadsheet.
Table A2.1. Summary textural classification of bottom sediment samples from Boston Harbor and Approaches, Massachusetts. Click on the Station number to view the sediment sample in the SEABOSS sampler following recovery and a summary of the sediment texture. Click the Photo name to view the sample photo. The complete sediment texture analysis is in table A2.1.
|
Station
|
Depth (m)
|
Shepard (1974) Classification
|
Photo
|
|
|
7.1
|
SAND
|
|
|
|
14.9
|
SAND
|
|
|
|
10.6
|
SAND
|
|
|
|
13.3
|
SAND
|
|
|
|
16.0
|
SAND
|
|
|
|
22.7
|
SAND
|
|
|
|
27.9
|
SAND
|
|
|
|
13.6
|
SAND
|
|
|
|
21.7
|
SILTY SAND
|
|
|
|
22.6
|
SAND
|
|
|
|
23.1
|
SANDY SILT
|
|
|
|
19.9
|
SANDY SILT
|
|
|
|
29.8
|
SILTY SAND
|
|
|
|
29.0
|
SILTY SAND
|
|
|
|
24.8
|
SAND
|
|
|
|
17.6
|
SAND
|
|
|
|
13.8
|
SAND SILT CLAY
|
|
|
|
6.9
|
SAND
|
|
|
|
8.9
|
SAND
|
|
|
|
9.7
|
SAND
|
|
|
|
12.5
|
SAND SILT CLAY
|
|
|
|
7.9
|
SAND SILT CLAY
|
|
|
|
6.9
|
GRAVELLY SEDIMENT
|
|
|
|
12.8
|
GRAVEL
|
|
|
|
6.6
|
SANDY SILT
|
|
|
|
7.0
|
SAND SILT CLAY
|
|
|
|
16.7
|
GRAVELLY SEDIMENT
|
|
|
|
5.7
|
CLAYEY SILT
|
|
|
|
6.6
|
SILTY SAND
|
|
|
|
8.5
|
GRAVEL
|
|
|
|
6.5
|
SAND SILT CLAY
|
|
|
|
5.3
|
GRAVELLY SEDIMENT
|
|
|
|
5.0
|
SILTY SAND
|
|
|
|
12.8
|
GRAVELLY SEDIMENT
|
|
|
|
7.1
|
SAND SILT CLAY
|
|
|
|
17.8
|
SAND
|
|
|
|
13.9
|
SAND
|
|
|
|
13.2
|
SILTY SAND
|
|
|
|
19.3
|
SILTY SAND
|
|
|
|
24.2
|
SANDY SILT
|
|
|
|
27.0
|
CLAYEY SILT
|
|
|
|
25.9
|
SILTY SAND
|
|
|
|
9.5
|
SAND
|
|
|
|
27.1
|
SAND
|
|
|
|
9.8
|
SAND
|
|
|
|
8.2
|
SAND
|
|
|
|
23.6
|
SAND
|
|
|
|
15.4
|
SAND
|
|
|
|
14.2
|
SAND
|
|
|
|
2.9
|
SILTY SAND
|
|
|
|
5.8
|
SAND SILT CLAY
|
|
|
|
5.4
|
CLAYEY SAND
|
|
|
|
4.8
|
SAND SILT CLAY
|
|
|
|
7.1
|
CLAYEY SILT
|
|
|
|
4.2
|
SAND SILT CLAY
|
|
|
|
10.2
|
SAND SILT CLAY
|
|
|
|
13.0
|
SILTY CLAY
|
|
|
|
13.1
|
SILTY SAND
|
|
|
|
12.9
|
SILTY CLAY
|
|
|
|
5.1
|
SILTY SAND
|
|
|
|
6.2
|
SAND SILT CLAY
|
|
|
|
13.0
|
CLAYEY SILT
|
|
|
|
5.7
|
CLAYEY SILT
|
|
|
|
6.7
|
CLAYEY SILT
|
|
|
Station
|
Depth (m)
|
Lat
|
Long
|
Gravel %
|
Sand %
|
Silt %
|
Clay %
|
Shepard (1974) Classification
|
|
1
|
7.1
|
42.27
|
-70.84
|
0
|
98.65
|
0.89
|
0.45
|
SAND
|
|
3
|
14.9
|
42.28
|
-70.83
|
0
|
84.17
|
12.94
|
2.89
|
SAND
|
|
4
|
10.6
|
42.29
|
-70.86
|
0
|
97.28
|
1.96
|
0.77
|
SAND
|
|
5
|
13.3
|
42.3
|
-70.85
|
0
|
96.15
|
2.3
|
1.56
|
SAND
|
|
6
|
16.0
|
42.3
|
-70.83
|
0
|
94.99
|
3.29
|
1.72
|
SAND
|
|
14
|
22.7
|
42.34
|
-70.84
|
2.52
|
91.88
|
4.03
|
1.57
|
SAND
|
|
15
|
27.9
|
42.34
|
-70.83
|
0.06
|
84.43
|
11.64
|
3.86
|
SAND
|
|
18
|
13.6
|
42.32
|
-70.87
|
3.93
|
81.24
|
8.66
|
6.17
|
SAND
|
|
19
|
21.7
|
42.34
|
-70.86
|
0
|
67.28
|
24.9
|
7.82
|
SILTY SAND
|
|
20
|
22.6
|
42.35
|
-70.86
|
1.44
|
83.39
|
9.17
|
5.99
|
SAND
|
|
25
|
23.1
|
42.33
|
-70.85
|
0
|
32.39
|
54.64
|
12.97
|
SANDY SILT
|
|
27
|
19.9
|
42.31
|
-70.83
|
0
|
41.77
|
48.63
|
9.59
|
SANDY SILT
|
|
29
|
29.8
|
42.37
|
-70.84
|
0.03
|
49.87
|
37.38
|
12.72
|
SILTY SAND
|
|
30
|
29.0
|
42.36
|
-70.85
|
0.5
|
58.76
|
32.91
|
7.83
|
SILTY SAND
|
|
33
|
24.8
|
42.36
|
-70.86
|
1.37
|
75.83
|
19.12
|
3.68
|
SAND
|
|
36
|
17.6
|
42.37
|
-70.91
|
0
|
87.24
|
9.31
|
3.45
|
SAND
|
|
39
|
13.8
|
42.34
|
-70.91
|
0
|
31.09
|
43.19
|
25.72
|
SAND SILT CLAY
|
|
41
|
6.9
|
42.35
|
-70.92
|
0.29
|
98.89
|
0.43
|
0.39
|
SAND
|
|
45
|
8.9
|
42.34
|
-70.95
|
0
|
96.29
|
1.71
|
2
|
SAND
|
|
48
|
9.7
|
42.36
|
-70.94
|
0
|
97.89
|
1.32
|
0.79
|
SAND
|
|
52
|
12.5
|
42.34
|
-70.96
|
0
|
44.73
|
27.56
|
27.71
|
SAND SILT CLAY
|
|
55
|
7.9
|
42.32
|
-70.94
|
0.1
|
40.74
|
32.67
|
26.49
|
SAND SILT CLAY
|
|
56
|
6.9
|
42.32
|
-70.96
|
10.19
|
74.17
|
10.32
|
5.32
|
GRAVELLY SEDIMENT
|
|
58
|
12.8
|
42.3
|
-70.94
|
55.87
|
39.49
|
3.1
|
1.54
|
GRAVEL
|
|
60
|
6.6
|
42.3
|
-70.91
|
0
|
31.96
|
50.71
|
17.33
|
SANDY SILT
|
|
61
|
7.0
|
42.29
|
-70.92
|
0
|
31.33
|
42.57
|
26.1
|
SAND SILT CLAY
|
|
62
|
16.7
|
42.31
|
-70.92
|
23.23
|
66.33
|
5.46
|
4.97
|
GRAVELLY SEDIMENT
|
|
63
|
5.7
|
42.3
|
-70.97
|
0
|
15.25
|
49.67
|
35.08
|
CLAYEY SILT
|
|
64
|
6.6
|
42.32
|
-70.94
|
0
|
66.41
|
19.98
|
13.61
|
SILTY SAND
|
|
65
|
8.5
|
42.29
|
-70.96
|
67.41
|
39.72
|
0
|
0
|
GRAVEL
|
|
66
|
6.5
|
42.3
|
-70.94
|
0
|
28.71
|
33.6
|
37.69
|
SAND SILT CLAY
|
|
68
|
5.3
|
42.3
|
-70.98
|
19.39
|
16.2
|
32.02
|
32.4
|
GRAVELLY SEDIMENT
|
|
69
|
5.0
|
42.27
|
-70.93
|
0.04
|
69.8
|
19.35
|
10.81
|
SILTY SAND
|
|
70
|
12.8
|
42.33
|
-70.99
|
10.4
|
45.13
|
18.52
|
25.95
|
GRAVELLY SEDIMENT
|
|
71
|
7.1
|
42.33
|
-71
|
0
|
42.01
|
36.15
|
21.84
|
SAND SILT CLAY
|
|
72
|
17.8
|
42.38
|
-70.91
|
0.03
|
83.17
|
13.83
|
2.97
|
SAND
|
|
74
|
13.9
|
42.38
|
-70.93
|
0
|
90.41
|
8.36
|
1.22
|
SAND
|
|
76
|
13.2
|
42.38
|
-70.95
|
0
|
68.1
|
30.48
|
1.42
|
SILTY SAND
|
|
77
|
19.3
|
42.39
|
-70.92
|
0
|
54.89
|
33.5
|
11.61
|
SILTY SAND
|
|
78
|
24.2
|
42.4
|
-70.9
|
0
|
37.92
|
56.76
|
5.32
|
SANDY SILT
|
|
79
|
27.0
|
42.4
|
-70.89
|
0
|
13.22
|
64.19
|
22.59
|
CLAYEY SILT
|
|
85
|
25.9
|
42.41
|
-70.9
|
0
|
56.31
|
37.24
|
6.45
|
SILTY SAND
|
|
87
|
9.5
|
42.41
|
-70.95
|
0.26
|
89.9
|
9.06
|
0.77
|
SAND
|
|
88
|
27.1
|
42.42
|
-70.89
|
0.59
|
75.2
|
19.7
|
4.51
|
SAND
|
|
90
|
9.8
|
42.43
|
-70.91
|
0
|
95.21
|
2.16
|
2.63
|
SAND
|
|
91
|
8.2
|
42.4
|
-70.95
|
0.03
|
92.75
|
4.31
|
2.91
|
SAND
|
|
92
|
23.6
|
42.38
|
-70.88
|
0.35
|
75.9
|
10.16
|
13.59
|
SAND
|
|
93
|
15.4
|
42.4
|
-70.93
|
0.25
|
85.11
|
11.51
|
3.13
|
SAND
|
|
94
|
14.2
|
42.38
|
-70.93
|
0
|
87.73
|
9.69
|
2.58
|
SAND
|
|
95
|
2.9
|
42.35
|
-70.97
|
0
|
66.49
|
22.82
|
10.68
|
SILTY SAND
|
|
96
|
5.8
|
42.35
|
-70.98
|
0
|
25.61
|
49.58
|
24.81
|
SAND SILT CLAY
|
|
97
|
5.4
|
42.34
|
-70.99
|
1.59
|
58.92
|
18.63
|
20.86
|
CLAYEY SAND
|
|
98
|
4.8
|
42.35
|
-71
|
0
|
33.24
|
36.85
|
29.91
|
SAND SILT CLAY
|
|
99
|
7.1
|
42.35
|
-70.99
|
0
|
17.49
|
42.13
|
40.38
|
CLAYEY SILT
|
|
100
|
4.2
|
42.36
|
-70.98
|
0
|
21
|
50.06
|
28.93
|
SAND SILT CLAY
|
|
101
|
10.2
|
42.34
|
-71.01
|
0
|
21.91
|
49.13
|
28.95
|
SAND SILT CLAY
|
|
103
|
13.0
|
42.37
|
-71.04
|
0.11
|
15.21
|
38.47
|
46.21
|
SILTY CLAY
|
|
104
|
13.1
|
42.38
|
-71.05
|
2.24
|
64.92
|
21.63
|
11.22
|
SILTY SAND
|
|
105
|
12.9
|
42.36
|
-71.03
|
0.32
|
2.95
|
46.55
|
50.18
|
SILTY CLAY
|
|
106
|
5.1
|
42.32
|
-71.01
|
6.32
|
56.78
|
18.92
|
17.98
|
SILTY SAND
|
|
110
|
6.2
|
42.33
|
-70.97
|
1.07
|
50.79
|
25.28
|
22.86
|
SAND SILT CLAY
|
|
111
|
13.0
|
42.34
|
-71.03
|
0
|
6.8
|
53.67
|
39.54
|
CLAYEY SILT
|
|
112
|
5.7
|
42.37
|
-70.99
|
0.1
|
17.38
|
47.26
|
35.26
|
CLAYEY SILT
|
|
113
|
6.7
|
42.38
|
-71.01
|
0
|
6.73
|
63.3
|
29.97
|
CLAYEY SILT
|
 Back to Appendix 1 Back to Appendix 1  To Top of Page To Top of Page  Forward to Next Section Forward to Next Section
|
