USGS Coastal and Marine Geology Program
|
|
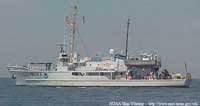
Section 3 - Data Collection and ProcessingField programThe NOAA Ship Whiting (fig. 3.1) and its launches conducted four hydrographic surveys (table 3.1) of the navigable areas within Boston Harbor and its approaches in 2000 and 2001. These cruises acquired sidescan-sonar data over an area of 155 km2 and single-beam bathymetric data over an area of approximately 170 km2. In addition, multibeam echosounder data were acquired over 65 km2 (approximately 37% of the full survey area). The multibeam echosounder data were collected primarily in the navigation channels between the Harbor Islands and in areas of potential hazards to navigation and do not provide seamless coverage of the entire region. All geophysical data were collected by the NOAA National Ocean Service (NOS) and provided to CZM and the USGS in 2003. No new geophysical data were collected as part of this project.
Table 3.1. NOAA Hydrographic Survey areas
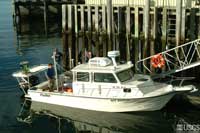
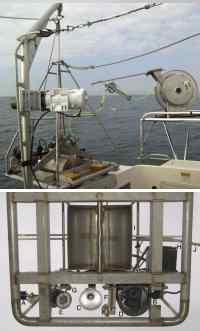
NOAA provided raw sidescan-sonar datasets in XTF format for all four surveys, and the CARIS HIPS/SIPS (Hydrographic Information Processing System/Sonar Information Processing System) database. Additional information about the NOAA hydrographic acquisition systems, including standard configurations and typical operating procedures, can be found in the NOAA Data Acquisition and Processing Report (NOAA DAPR, 2001) for project OPR-A397-WH and in the individual Descriptive Reports for surveys H10990, H10991, H10992 and H10994 (NOAA 2001a,b,c,d). In order to ground-truth, or validate, the geophysical data, direct sampling and photographic observations were collected during a 4-day cruise aboard the USGS R/V Rafael (fig. 3.2) in 2004. Bottom video, high-resolution digital bottom photographs and sediment samples were collected using the USGS mini-SEABOSS (SEABed Observation and Sampling System (fig. 3.3). Sidescan-SonarThe NOAA hydrographic surveys were designed to collect overlapping sidescan-sonar data to ensure complete coverage of the sea floor. This complete coverage, in which much of the study area was imaged at least twice by sidescan-sonar, was achieved for most of the 155 km2 survey area in order to identify all hazards to navigation. NOAA surveys utilized either the Edgetech model 272-T (100 kHz) or the “high-speed/high-resolution” Klein T-5500 (455 kHz) sonar for sidescan-sonar acquisition. System and vessel configurations varied between and within the different surveys (table 3.2). Table 3.2. Vessel, System and Survey Configurations
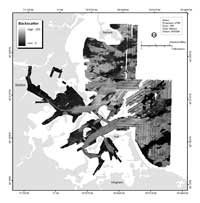
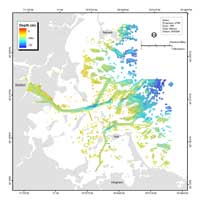
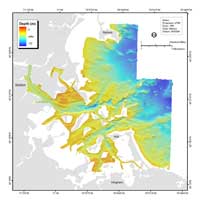
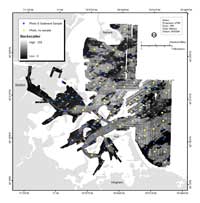
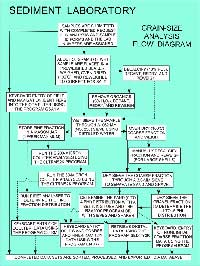
Triton Elics ISIS acquisition software (version 5.0), was used to record sidescan-sonar data in XTF format. Data were archived by the NOAA Office of Coast Surveys. Adjustments to the survey design, including changes to line spacing, sonar range and gain were made as necessary during acquisition and are reflected in the raw sidescan-sonar data. Raw sidescan-sonar data were initially examined using Chesapeake Technology’s SonarWeb and SonarWiz.Map software (http://www.chesapeaketech.com/) to determine acquisition parameters. The CARIS database also provided necessary information to process the sonar data. After acquisition parameters were established the Linux-based software Xsonar/ShowImage (Danforth, 1997) was used to import and process 1682 files (or 2296 linear km) of the sidescan-sonar data. The following processing routines were applied to correct for radiometric and geometric distortions in the sidescan-sonar data. The data XTF data were demultiplexed, eliminating speckle noise by applying a user-specified median filter (Danforth, 1997). Navigation data were extracted from the sonar file, checked for erroneous fixes, edited and remerged with the data file. Corrections to tow-fish altitude were performed manually on a line-by-line basis to delineate the seafloor-water interface. A slant-range correction was applied, converting slant-range distances to true ground range. A beam-pattern routine was used to correct for beam attenuation and spreading loss with range. Raw image files of each trackline were exported from Xsonar and towfish layback was applied where necessary. Sidescan-sonar data were mosaicked using PCI Geomatics (version 8.2), and exported as georeferenced TIFF image files (1 meter/pixel resolution, fig 3.4). Due to gain changes and internal inconsistencies, the dynamic range of surveys varied. Thus, tone-matching was applied in order to generate a final mosaic. Multibeam Echosounder BathymetryThe multibeam echosounder bathymetric data were collected in the navigation channels and at numerous site specific locations in Boston Harbor and the harbor approaches (fig. 3.5). Multibeam echosounder data from the Boston Harbor hydrographic surveys cover an area of approximately 64 km2, with the most dense multibeam echosounder coverage in the navigation channels (President Roads, North Channel, South Channel, Nantasket Roads, and Hypocrite Channel), Boston Inner Harbor, and east of the outer Boston Harbor Islands (covering Boston Ledge and Martin Ledge). Multibeam echosounder data cover approximately 37% of the area mapped by the single-beam echosounder system. A hull-mounted Reson SeaBat 8101 was used to acquire the multibeam echosounder data. The Reson SeaBat 8101 is a 1.5º beam angle system which operates at a frequency of 240 kHz and a maximum vessel speed of 6 knots. The system is designed for operation in water depths of 5 to 125 m, and has a horizontal range of 75 to 500 m, depending on water depth. The system collects 101 individual soundings in a swath oriented perpendicular to the vessel track. Acquisition was monitored in real time with the Triton Elics ISIS software (version 5.29) and recorded in XTF format. NOAA Office of Coast Survey converted the XTF data to CARIS HDCS (Hydrographic Data Cleaning System) format, then processed and tide-corrected the data with CARIS HIPS (Hydrographic Information Processing System) software. The soundings were reduced to Mean Lower-Low Water (MLLW) using tide data from the Boston, MA station 844-3970. Tide-corrected multibeam echosounder soundings were exported from CARIS HIPS at a 2-meter grid interval and reformatted for input into the SwathEd processing software (University of New Brunswick Ocean Mapping Group, 2005). Soundings were gridded using the “weigh_grid” routine creating 2-meter bathymetry grids. The OMG (Ocean Mapping Group) grid format was converted to ASCII raster format, imported to ESRI ArcGIS 9.0 and merged to create a master grid of multibeam echosounder bathymetry (fig. 3.5). Single-beam Echosounder BathymetryThe NOAA survey vessels were equipped with Odom Echotrac DF3200 MKII echosounders that logged high-frequency (100 kHz) single-beam soundings throughout the sidescan-sonar and multibeam echosounder operations. Single-beam soundings were recorded in Hypack format and later converted to CARIS HDCS format. The NOAA Office of Coast Survey cleaned and merged the data and performed tide corrections using CARIS HIPS. The soundings were reduced to Mean Lower-Low Water (MLLW) using tide data from the Boston, MA station 844-3970. Combined BathymetryThe single-beam and multibeam echosounder data were used to create a composite bathymetry grid (fig. 3.6). Multibeam echosounder data were exported from CARIS HIPS at a 2-meter grid interval; single-beam soundings were exported at a 5-meter grid interval. The single-beam data from survey H10991 were processed by NOAA prior to their use of CARIS and a separate xyz file was provided for these soundings. The eight soundings files were merged to create a master file of over 17 million soundings within the survey areas. GMT (Generic Mapping Tools - http://gmt.soest.hawaii.edu/) was used to create an interpolated grid of the bathymetry for the entire region. Bathymetry data were formatted for input into GMT and then filtered through the GMT block median routine in order to increase processing speeds. An interpolated grid was created using the GMT “surface” routine with a grid cell size of 30 m and a tension parameter of 0.5. The GMT grid was converted to a 32-bit TIFF image using the Gdal utility “gdal_translate” (FWTools, version 1.0.0a7 and Gdal, version 1.3.1). The TIFF image was converted to a bathymetry grid with cell size of 30 m within ESRI ArcGIS. A depth-colored shaded relief grid (fig. 3.6) shows the sea-floor topography based on the combined single-beam and multibeam echosounder data. The composite bathymetry grid was created at a 30 meter/pixel resolution due to the widely-spaced soundings from the vertical-beam survey. Other historical soundings are available for the area (e.g. NOAA Coastal Relief Model from the National Geophysical Data Center (http://www.ngdc.noaa.gov/) and the NOAA Estuarine Bathymetric Datasets (http://spo.nos.noaa.gov/bathy/)). Sampling, Bottom Photographs and VideoSurficial sediment samples and photographs of the sea floor were obtained on a cruise conducted by the USGS and CZM September 14-17, 2004 (USGS cruise #04019). One hundred-thirteen stations were identified for sampling and photography with the mini-SEABOSS sampler (fig. 3.3). These stations were selected based on backscatter variations within the sidescan-sonar imagery in order to identify the surface sediment within these varying backscatter regions (fig. 3.7). Additionally, samples were collected across transition zones, where abrupt changes in backscatter intensity suggested changes in the character of the sea floor. The station procedure was to position the vessel within about 10 m of the target location, deploy the mini SEABOSS to about 1 m above the sea floor, and then drift with the current, typically at speeds of 1-3 knots. Continuous video data were collected while the camera was within sight of the bottom and still photographs were obtained from a high-resolution digital camera at operator-selected locations along the drift transect. At each station about 5-10 minutes of video and 5-15 bottom photographs were obtained. Sediment samples were typically collected at the end of the drift transect using a modified VanVeen grab sampler. The sample was photographed in the grab sampler after recovery (Appendix 2) and the upper 2 cm of sediment were scraped from the surface of the grab for textural analysis. The sediment samples could only be obtained at locations with relatively soft sediment (sand or mud) with the mini-SEABOSS; samples could not be collected from cobble or rocky bottoms. Samples were analyzed (table 4.1) for grain size at the USGS Woods Hole Science Center (WHSC) Sediment Lab using standard procedures described by Poppe and Polloni (2000) (fig. 3.8). Qualitative visual interpretations of the sediment in the bottom photographs were compared with the sediment texture analyses. NavigationNOAA survey vessels used in the 2000-2001 surveys of Boston Harbor were equipped with Trimble DSM212L Differential Global Positioning System (DGPS) receivers. Launch 1005, which collected all of the multibeam echosounder bathymetry, was also equipped with a TSS POS/MV Model 320 (Position and Orientation System for Marine Vessels). Standard bathymetric processing, including tide corrections, accuracy, and quality control were conducted by NOAA Office of Coast Survey (NOAA Data Acquisition and Processing Report: OPR-A397-WH). Navigation for the sampling survey on the R/V Rafael used DGPS. Navigation was logged every 1 second with Hypack Inc. HypackMax software (version 4.3a) and the navigation fixes were later parsed and merged into a GIS shapefile for mapping the location of bottom photographs and the video transects. |
| |||||||||||||||||||||||||||||||||||||||||||||||||||||||||||||||||||||||||||||||||||||

 Back to Maps
 Forward to Next Section