USGS Coastal and Marine Geology Program
|
|
Section 4: Discussion
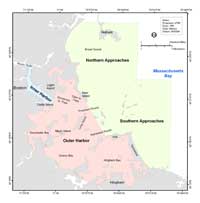
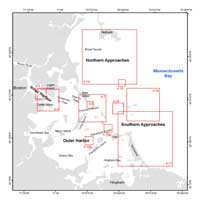
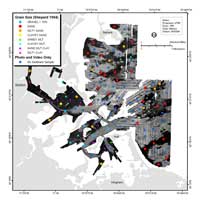
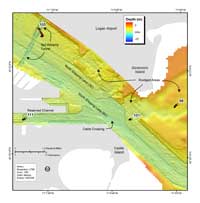
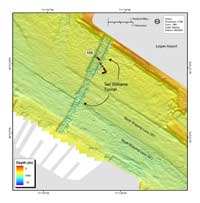
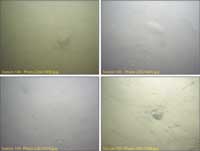
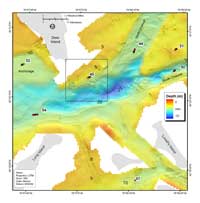
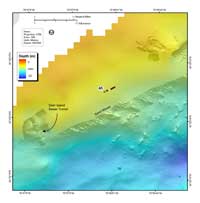
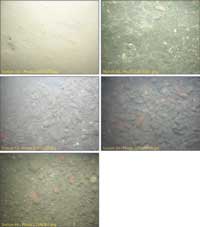
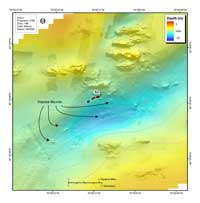
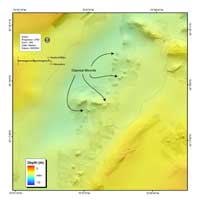
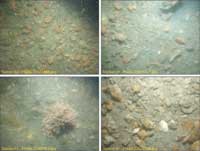
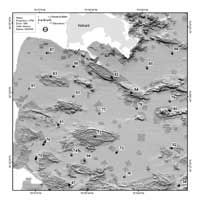
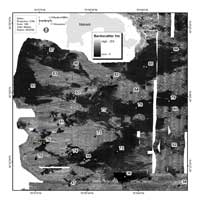
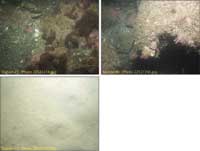
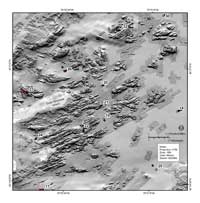
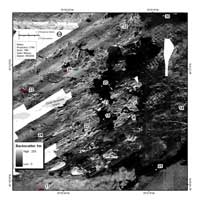
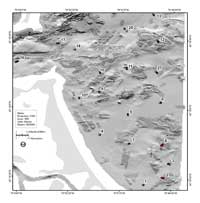
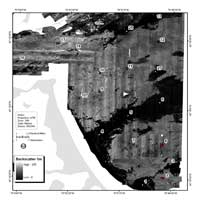
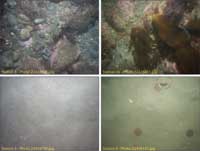
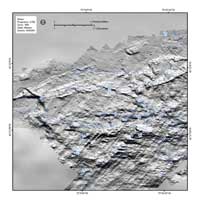
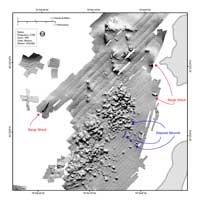
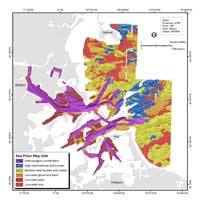
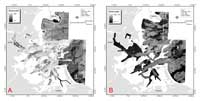
SettingThe study area for the Boston Harbor and Approaches project lies within the structurally complex Boston Basin of late Precambrian age (Kaye, 1982). The bedrock within and surrounding Boston Harbor is part of the Avalon terrane, a Precambrian island arc terrane comprised of volcanic and plutonic rocks that formed approximately 600 million years ago. Rifting towards the end of the Precambrian (>540 Ma) created what would become the Boston Basin, and eventually lead to the separation of Avalon and other exotic terranes from the ancient supercontinent of Gondwana. The Avalon terrane was later accreted to the Laurentia supercontinent during the Acadian Orogeny (Skehan 2001, Rankin and others 1989, Williams and Hatcher 1983). The Alleghanian Orogeny, the final major mountain building event along eastern North America (290-250 Ma), is probably responsible for much of the structural framework of the eastern continental margin as it exists today (Hatcher 1989, Hatcher and Goldberg 1991). Compression from the Alleghanian Orogeny is thought to overprint most compressional signatures of the Acadian Orogeny in the northeastern U.S. (Osberg and others 1989, Rast 1989). The last major tectonic event in the region was the formation of numerous rift basins and basalt intrusions in eastern Massachusetts as a result of the opening of the Atlantic Ocean (~200 Ma; Skehan 2001). The Boston Harbor area has been sculpted by multiple glaciations during the Quaternary Period, the last 1.8 million years. The most recent Ice Age reached its maximum extent south of Cape Cod about 21,000 years ago. Glaciers retreated northward across the study area as the climate warmed, passing the present coast about 14,500 years ago (Kaye and Barghoorn, 1964). Most of the islands in the inner harbor are drumlins, oblong hills of glacial till that formed beneath the ice sheets. Numerous other drumlins, eskers, kettle lakes and moraines are found around the Boston area (Newman and others 1990) and in submerged areas of Massachusetts Bay (Oldale and others, 1994). The retreating glaciers left behind two drifts of glacial sediment in Massachusetts Bay, the older described as a compacted till of cobbles and boulders, and the younger consists of till, outwash sand, gravel, and glacial-marine mud (Knebel and Circe 1995). The glacial-marine sediment was deposited contemporaneously with ice retreat, blanketing wide areas of the coast and inner shelf in northeastern Massachusetts. Known as the "Boston Blue Clay" (Kaye and Barghoorn, 1964), this glacial-marine sediment unconformably overlies older glacial deposits and bedrock. It typically consists of well stratified sand and mud with scattered dropstones of ice-rafted material, and constitutes much of the harbor bottom (Knebel and others, 1992). Relative sea-level change has influenced the geologic evolution of Boston Harbor. As the glaciers retreated northward, the sea migrated in contact with the ice margin and inundated the harbor area. Relative sea level rose to about 12 m above present sea level in this initial transgression, and then fell to a depth of at least -22 m (Kaye and Barghoorn, 1964) due to isostatic rebound of the coast. Studies by Oldale and others (1993), suggest that sea level fell as far as -50 m, exposing the harbor bottom and inner continental shelf. As glacial-isostatic rebound decreased, sea level rose at varying rates, causing a second transgression of the coast that continues today. These shoreline migrations have allowed marine processes to rework wide areas of the harbor and adjacent Massachusetts Bay. Erosion of drumlins and other glacial deposits have provided sand for construction of beaches, spits, and tombolos and left behind lags of coarse sediment on the sea floor including cobbles and boulders. Knebel and others (1991) identified four distinct backscatter patterns within Boston Harbor, based on isolated sidescan-sonar surveys. These data were used to show the distribution of sedimentary environments within Boston Harbor and the approaches. These maps encompassed an area of 140 km2 in the Outer Harbor and the harbor approaches; extending to the eastern-most harbor island. Additional data including bathymetric data, sediment samples, cores, bottom photographs and seismic reflection data, were used to define the sedimentary environments and to extrapolate the surficial distributions where sidescan-sonar data were unavailable. Sea-Floor Character of Boston Harbor and ApproachesBoston Harbor is an urban estuary located at the western-most extent of Massachusetts Bay (Knebel and others, 1991) and is home to one of the oldest and most active maritime ports along the U.S. Atlantic Coast (fig. 1.1). This study encompasses Boston Inner Harbor, Boston Outer Harbor, the northern approaches to Boston Harbor (Broad Sound; north of the Harbor Islands to Nahant), and the southern approaches to Boston Harbor (outer Harbor Islands and nearshore east of Nantasket Beach) (fig. 4.1). The seaward limit of Boston Harbor is defined by a line between Deer Island and Point Allerton on the Hull peninsula; “the approaches” extend 6 km eastward into Massachusetts Bay (Knebel and others, 1991). Castle Island and the southern end of Logan Airport separate the Inner and Outer Harbor. The Inner Harbor contains the main shipping channel and the Port of Boston, as well as the mouths of the Charles and Mystic Rivers. The Outer Harbor consists of Hingham, Quincy and Dorchester Bays and most of the 34 islands maintained by the Boston Harbor Islands Partnership, a cooperative of federal, state, local and private organizations lead by the National Parks Service (BHI 2002). Marine traffic passes in and out of Boston Harbor through two primary shipping lanes: (1) President Roads, lying south of Deer Island, connects the North and South Channels to Boston Inner Harbor and Dorchester Bay, and (2) Nantasket Roads, lying south of George’s Island, services Quincy and Hingham Bays (fig. 4.1). The bathymetry and sidescan-sonar data show natural features and sea floor modification from anthropogenic activities. Dredging and other anthropogenic activities are generally focused in the shipping channels. Evidence of dredging is visible within the imagery as straight-sided channels, unnatural-appearing roughness and/or linear features on the sea floor that are typically oriented parallel to a channel. Disposal of dredged material is clearly displayed within the multibeam echosounder data as rounded mounds; often occurring in a straight line, some have a central high and a surrounding moat thought to be created as the material was deposited on the sea floor. The mounds sometimes are identified in the sidescan-sonar by high backscatter intensity, but are not always resolved. Other anthropogenic features on the sea floor include wrecks of small boats and barges, pipelines, and piles of debris. Almost all of the Inner Harbor from Castle Island to Long Wharf was mapped by multibeam echosounder. In the Outer Harbor and the Harbor Approaches, the 2-m resolution multibeam echosounder data are displayed with the 30-m resolution single-beam echosounder data; interpretation of features and their spatial extent is limited by these mixed observations. The sea-floor landscape varies from gently sloping sub-tidal flats to areas of rugged elevation exhibiting as much as 7 m of local relief (sheet 1, fig. 3.6). The acoustic backscatter intensity (sheet 3, fig. 3.7) illustrates the general distribution of surficial sediment. The approaches to Boston Harbor and the dredged navigation channels around the Harbor Islands are generally characterized by high backscatter, bedrock, boulder, cobbles, or dense shell beds. The Inner and Outer Harbor are primarily composed of fine-grained sediments, such as fine sand or mud, which displays as low backscatter within the sidescan-sonar imagery (fig. 4.3). Sea-floor topography and surficial character in the study area vary at scales of several meters and less. For example, high relief bedrock and bouldery glacial deposits (till) are commonly exposed on the sea floor in close proximity to flat-lying deposits of finer sediment (sand, mud). Rocky areas sometimes contain isolated accumulations of shelly sediment that are ponded in small cracks or low-lying areas between rock outcrops. Boston Inner Harbor The bathymetry and surficial character of the sea floor within the Inner Harbor reflect a long history of dredging in the study area (for example, see the circular features near 42° 20' 51", 71° 0' 40.8" W and the trapezoidal area centered near 42° 20' 40.2", 71° 0' 45" W, sheet 1, fig. 4.4). The north side of the main navigation channel south of Logan Airport is dredged to a depth of 35’ (about 10.7 m) and the south side to a depth of 40’ (about 12 m) (NOS Chart 13272). The Ted Williams Tunnel runs under the navigation channel between South Boston and Logan Airport (fig. 4.5). On the sea floor, the tunnel is marked by a depression about 50 m wide that is a few m deeper than the navigation channel; on the northern side of the channel, the tunnel depression has a central high and channels about 2-4 m deeper along the western and eastern edges. The multibeam echosounder data do not extend over the Callahan or Sumner Tunnel. The sea floor of the Reserved Channel and a trapezoidal area across the main channel to the east of the Reserved Channel (centered near 42° 20' 40.2" N, 71° 0' 45" W, dredged to 40’) have a rough appearance, in contrast to the relatively smooth main channel (fig. 4.4). A linear feature about 5 m wide and less than 1 m deep runs east-west across the main channel near 42° 20' 33" N, 71° 0' 30" W; this feature is in a cable area (NOS Chart 13272) (fig. 4.4). Throughout the inner harbor the sea floor is marked by numerous linear features, presumably scours from wire and anchor drags (fig. 4.4). There are also some depressions (for example near 42° 21' 34.8' N, 71° 2' 25.8" W), typically less than 20 meters in spatial extent and a few m deep, thought to be caused by dredging. Low backscatter intensity material covers most of the Inner Harbor, representing fine-grained sediments (sheets 3, 4 and 5, fig. 4.3). Moderate backscatter intensity occurs in the shipping channel east of Castle Island and in the northern part of the Inner Harbor east of Boston. The cover of the Ted Williams tunnel shows moderate backscatter. The finest sediments sampled in this survey, at the mouth of the Mystic River, contained over 40% clay. Photographs (stations 104, 103, 105, 106; fig. 4.6) show a soft, muddy sea floor. Boston Outer Harbor The Outer Harbor contains the Harbor Islands and major shipping channels that provide access to the Port of Boston and the communities of Quincy, Weymouth, and Hingham. The northern part of the Outer Harbor contains the sub-tidal Governors Island Flats and Deer Island Flats (east of Logan Airport), bounded to the south by President Roads and the President Roads Anchorage. The sediments on the flats are characterized by low backscatter intensity. A series of irregularly-shaped dredged areas with linear edges are located south and east of Logan Airport and continue to the north into Winthrop Bay (sheet 1, fig. 3.6). The area centered near 42° 20' 45.6" N, 70° 59' 57.6" W is 4-6 m deep with an irregular sea floor; the area centered near 42° 21' 10.8" N, 70° 59' 3.6" is about 6 m deep with a nearly flat sea floor. The deepest water in Boston Harbor, about 28 m deep, occurs in a depression about 2 km long and 200 m wide located south of Deer Island (sheet 1, fig. 4.7). Along the northern side of this depression, the sea floor is covered by a series of sand waves about 10 m in wavelength and less than a meter high (fig. 4.8). These sand waves coalesce into a single high and disappear at about 14-15 m water depth. Three additional depressions, with water depths in excess of 20 m, trend east-northeast from the low south of Deer Island along the axis of the south Channel. Backscatter intensity changes from low in the inner harbor to high over a distance of about 1 km near 42° 20' 0" N, 70° 58' 48" W (south of the western end of the anchorage) where the water begins to deepen at about 15 m depth (sheet 3, fig. 3.4). Backscatter intensity of the sea floor is high from this point eastward in the north and south channels and into the Approaches. Photographs of the sea floor along the navigation channel show a transition from a muddy sea floor in the Inner Harbor to a gravel pavement in the outer Harbor (stations 101, 70, 53, 54, 44, fig. 4.9, Appendix 3). In the southern part of the Outer Harbor, bathymetric and sidescan-sonar mapping were conducted mostly in water depths greater than 6 meters and focused in Nantasket Roads and the smaller navigation channels around the Harbor Islands and those leading into Quincy and Hingham and Hull Bays. The deepest water occurs in two natural lows, one in Nantasket Roads north of Hull and centered near 42° 18' 48" N, 70° 55' 6" W, 22 m deep, and one south of Hull and centered near 42° 17' 36" N, 70° 55' 6" W, 18 m deep (sheet 1, fig. 3.6). Individual dumps of material are found in the topographic lows north of Hull (fig. 4.10a) and north of Peddocks Island (fig. 4.10b). High backscatter intensity material is found in Nantasket Roads, on the topographic high (Hospital Shoal) east of Rainsford Island, in the channel between Rainsford and Long Island, to the west and southwest of Peddocks Island, and in the low south of Hull (sheet 3, fig. 3.4). Bottom photographs in these areas (stations 62, 58, 65, 67, fig. 4.11) show a gravel pavement on the sea floor. The areas south of Long Island, in the entrance to Quincy Bay (station 63) and southeast of Peddocks Island (station 61) in the entrance to Hingham Bay, show low backscatter intensity and bottom photographs show a muddy sea floor (fig. 4.12). On the margins of the navigation channels and where the surveys extend into the sub-tidal flats of Hull, Hingham, Quincy Bays, the sea floor is covered with fine muddy sediment that shows low backscatter intensity. Approaches to Boston Harbor The Approaches to Boston Harbor are characterized by areas with rough topography (sheet 1 and 2), elevated sea floor and high backscatter intensity (sheet 3 and 4) and areas of smooth topography and low backscatter intensity. The high-backscatter intensity areas are typically covered by outcropping rock, boulders, cobbles and gravel; the low backscatter intensity areas are typically covered by sandy sediments (sheets 1, 3, 5, fig. 4.3). The sea floor in President Roads and in the North and South channels is characterized by high backscatter (sheet 3, fig. 4.3). Bottom photographs and video at stations 44, 53, 54 (sheet 5, fig. 4.9, Appendix 3) show mostly cobbles that were too coarse for retrieval; no sediment samples were collected in these areas. At station 50 in the South Channel the sea floor was a dense bed of mussel shells (fig. 4.13). Rippled sands are found within a low backscatter region at station 45, southeast of Deer Island and north of the navigation channel (fig. 4.13). In Broad Sound there are features elevated 4-5 m from the surrounding sea floor, characterized by rough topography and high backscatter (e.g. centered near 42° 23' 6" N, 70° 55' 18" W and near 42° 24' 30" N, 70° 55' 6" W, fig. 4.14a, 4.14b). The north or northeast facing side of these features rises abruptly about 3 m above the surrounding sea floor. Photographs show these features to be covered by gravel, cobbles and boulders (stations 73, 84, fig. 4.15). These features are most likely drumlins that were eroded and reworked during the last rise in sea level, leaving behind the coarse sediments. The low backscatter sea floor between these elevated areas is sand (fig. 4.3, fig. 4.15) A series of high backscatter outcropping ledges lie east of the Brewster Islands, for example near 42° 20' 6" N, 70° 52' 36" W (fig. 4.16a, 4.16b). These ledges are bounded to the north by the Graves and to the south by Nantasket Roads and cover approximately 15 km2. The ledges trend east-northeast – west-southwest and have 4-7 m of local relief. East of Nantasket there are two areas characterized by variable topography (up to 4 m of local relief) and high backscatter intensity (fig. 4.17a, 4.17b). Based on bottom photographs and video, the local highs show with algae-covered rock outcrops and boulder- to cobble-sized sediment (fig. 4.18). These outcrop areas are separated by an approximately 700-m wide band characterized by uniformly low backscatter; sediment samples and bottom photographs obtained show the area is composed of well-sorted fine sand (fig. 4.18). Numerous individual high backscatter targets in the Approaches, 4-6 m in length and less than a meter high, are interpreted to be individual boulders and are observed in nearly all of the areas outside the harbor with rough sea floor topography (fig. 4.19). Although the multibeam echosounder data resolves individual boulders in the Harbor Approaches, the boulders are not observed in the sandy sediments immediately adjacent to these areas. The boulders are likely to be associated with glacial deposits. There are feweer similar targets within the Harbor, however, additional sampling is needed in order to assess similarities with targets within the Harbor Approaches. Several sunken barges and disposal mounds are observed in the area west of Great Brewster and Calf Islands (fig. 4.20). Sea-floor units Six sea-floor units defined by bottom slope, backscatter intensity, surficial sediment texture and anthropogenic activity were distinguished within the study area (sheet 5, fig. 4.21): High-relief bedrock and boulder, Medium-relief boulder and cobble, Low-relief gravel and sand, Low-relief mud, Low-relief sand, and Anthropogenic modification areas. These zones were delineated qualitatively at a scale of 1:30,000 in areas where both new sidescan sonar and bathymetric data are available (about 155 km2). Bottom slope was calculated from the 30-m gridded bathymetry as the average slope between the central pixel and the surrounding 8 pixels. Areas smaller than about 200 meters were not delineated. High-relief bedrock and boulder areas are characterized by local slopes of 4 to 30 degrees and high backscatter intensity. Bottom photographs and video in these areas show the sea floor covered by cobbles, boulders or outcropping bedrock; no sediment samples could be obtained in these rocky areas. Most of the high-relief bedrock and boulder area occur between the outermost Harbor Islands and the rocky ledges farther offshore to the east. Medium-relief boulder and cobble areas are characterized by local slopes of 1 to 4 degrees and high backscatter intensity. Bottom photos and video in these areas show the sea floor covered by gravel, cobbles and boulders. Most of the medium-relief boulder and cobble area occurs in the harbor approaches. Low-relief gravel and sand areas are characterized by a local slope of less than 1 degree and either high or mottled (patches of high/low) backscatter intensity and sandy sediments (e.g. stations 14, 15 and 92; see sheet 5). Bottom photographs and video obtained in areas near these sandy samples show gravel and cobble-sized sediment on a sandy or muddy substrate. Low-relief sand areas are characterized by local slope of less than 1 degree, predominately low backscatter intensity and uniform sandy sediments, confirmed by the sampling survey. Low-relief, low-backscatter sandy environments dominate the approaches to Boston Harbor. Low-relief mud areas are characterized by local slope of less than 1 degree, predominately low backscatter intensity, and fine-grained muddy sediments, confirmed by the sampling survey. Low-relief muddy environments lie within Boston Harbor. Anthropogenic modification areas have been altered by human activity. The most easily identified man-made artifacts are dredged channels and anchorage areas. The sea floor of Boston Harbor has been influenced by other activities, including the disposal of dredge spoils, placement of artificial reefs, construction of piers, laying of pipelines, and submerged wrecks. Areas of Anthropogenic Modification comprise all five sea-floor environments described above; however, the overprint of man-made artifacts dominates the other natural characteristics. Using NOAA Hydrographic Data for Geologic MappingNOAA carries out hydrographic surveys in navigable waters in selected areas throughout the country; using these data for geologic characterization is an opportunity to map the geology of new areas with modest additional field work. The experience of this project in obtaining, reprocessing, archiving, and interpreting the hydrographic data from Boston Harbor and Approaches provides some guidance for future efforts to utilize NOAA hydrographic data for geologic mapping. Multibeam and single-beam echosounder bathymetry The multibeam echosounder bathymetry were provided by NOAA as depth and location points and used without reprocessing. The data were easily incorporated into the GIS and were extremely useful in interpreting the sea floor geology. The data were gridded at 2 m resolution, a large improvement over previously available bathymetry at 30 m resolution (NOAA. 1998). In addition, the data were collected at one time, rather than an average of data collected over many years. The major limitation of these data is that they were collected only in the navigation channels and over potential hazards to navigation, and thus did not provide continuous coverage over the entire area. Combining the widely-spaced single-beam bathymetry with the high-resolution multibeam echosounder bathymetry was difficult. It was important to identify the spatial resolution of the data to facilitate interpretation of data collected at an uneven resolution (2 m for multibeam echosounder and 30 m for the combined single-beam/multibeam echosounder data). Sidescan-sonar This project reprocessed the NOAA sidescan-sonar data set that contained more than 230 Gbytes of data organized in over 1800 separate files. The data were filed by survey, vessel, system and survey day and often two or three of the NOAA vessels acquired data concurrently. The directory structure was extensive and file names had to be checked for duplicates. Use of the CARIS data base facilitated the data management. The sidescan-sonar data was collected to identify potential navigation hazards; identified targets were further investigated using the multibeam echosounder, or by divers. The gain of the sidescan system was adjusted in the field to provide the best target identification in the operating area, yielding data collected with different systems operating at different gains. The individual mosaics for each system and vessel configuration (see table 3.2 in Data Collection and Processing) were merged with relative ease as the range of backscatter intensities had little local variation within each survey area. Each individual survey (e.g. H10990, H10991, etc.) was made internally consistent and then normalized to create the complete mosaic for the entire project area. After reprocessing, the sidescan-sonar mosaic produced in the field was qualitatively similar to the reprocessed data when viewed at a scale of 1:25,000 (fig. 22). The major improvement in the reprocessed mosaic is a more consistent intensity as a result of tone-matching. However, some tonal artifacts remain in the final gray-scale backscatter mosaic (map sheet 3) that are visible in the colored backscatter intensity mosaic (map sheet 4). Other artifacts of data collection and environmental conditions also appear in the imagery that could not be rectified by reprocessing. The sidescan-sonar is useful as it is the data set with continuous high-resolution coverage over the entire survey area. |
| |||||||||||||||||||||||||||||||||||||||||||||||||||||||||||||||||||||||||||||||
|
|


 Back to Section 3
 Forward to Next Section