|
|
A wide range of instruments may be employed to measure current speed and direction; water temperature, conductivity, depth; turbidity, and suspended sediment concentrations; wave characteristics; near-bottom turbulence; and sea-floor topography in the coastal ocean. All the instruments used by WHSC investigators are powered by batteries and log data internally over the time deployed. Several kinds of structures such as surface moorings, subsurface moorings, and bottom-mounted tripods are used to support the instruments. Tripods and moorings have weights to hold them on the seafloor, and a float and release system to allow them to be recovered. These platforms were typically deployed in spatial arrays for 1 to 6 months as part of regional or process studies, or long-term monitoring programs.
This section describes the moorings and structures used to deploy oceanographic instruments in the field. Subsequent sections describe the instruments and sensors mounted on the platforms to make the observations. This information provides the background necessary for understanding the treatment of the measurements stored in the time-series database.
Tripods
Many USGS programs require measurements near the seafloor; these measurements are made from bottom tripods (structures that rest on the seabed and designed to have a minimal effect on flow). Several shapes and sizes of bottom frames have been used to make near-bottom measurements (fig. 4a-d; Butman and Folger, 1979). The tripods deployed are one to three meters tall and carry a suite of oceanographic sensors and dataloggers appropriate to the experiment.
The USGS Time-Series Data Base contains data collected by a variety of sensors and data-logging systems deployed on these tripod frames. Between 1975 and about 1993, the standard system used a SeaData data logger and measured near-bottom current speed with 2 Savonius rotors and current direction with a single vane, temperature, pressure, and turbidity (Butman and Folger, 1979). A downward-looking time-lapse camera was deployed to record changes to the sea floor. Between 1993 and about 2004, the standard system used a MIDAS data logger (Martini and Strahle, 1993) and measured near-bottom currents with 2 four-axis acoustic time of travel current-velocity sensors, temperature, conductivity, pressure, and turbidity. Downward-looking time-lapse camera systems were also deployed on these tripods. Since 2004, the tripods have been deployed with a variable configuration of sensors and data loggers. In addition to the near-bottom instrumentation, most of the tripods are fitted with an upward-looking ADCP that obtains measurements of currents throughout the water column.
Moorings
Surface and subsurface moorings are used to obtain measurements near the surface and in the water column (fig. 5a, fig. 5b, and fig. 5c). Moorings support a variety of instrument types, most commonly current meters and temperature/conductivity/transmission sensors. Surface buoys may support near-surface sensors and meteorological sensors. Subsurface moorings are routinely kept taut and upright with subsurface flotation.
Deployment and Recovery Documentation
Metadata (information about when, where, and how instruments were deployed and recovered) are recorded for each experiment. Information is entered into standard log sheets during instrument preparation, at deployment, and on recovery to document how instruments were prepared for an experiment, what sensors were deployed on the platform, and how they were configured. The data from the mooring logs filled out at sea are entered into a summary Excel spreadsheet that contains a tabular representation of the log. The paper logs are scanned and are archived in the Woods Hole Science Center Data Library. Information about maintenance, performance, and pre-deployment checkout and setup is recorded in an instrument log.
The following information is recorded on the mooring log sheets, for all mooring deployments:
- Experiment name
- Deployment date and time
- Location of deployment (body of water and exact position)
- Deployment ship and personnel
- Scientific principal investigator (PI)
- Mooring or tripod identifier
- Instruments and serial numbers deployed on the mooring or tripod and their locations (height above bottom)
- Water depth at the deployment position
- Recovery date and time
- Recovery ship and personnel
- Comments about equipment condition or status
The following information is recorded for each instrument:
- Serial number and model number
- Firmware version
- Orientation (up, down, sideways)
- Sampling rate and schedule
- Number of variables (or bytes) per record
- Additional sensors that may be connected to a logger
- Clock comparisons at beginning and end to assess drift
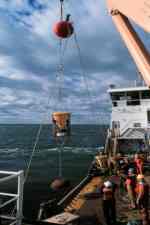
Figure 5A. Subsurface mooring that includes a 36 inch steel float (orange ball) with temperature-salinity sensor attached, and a time-series sediment trap (yellow cone) being deployed from U.S. Coast Guard Cutter Marcus Hanna in Massachusetts Bay. |
Figure 5B. Schematic diagram of a subsurface mooring to be deployed at 31.5 meters depth. |
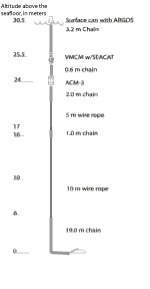
Figure 5C. Schematic diagram of a surface mooring to be deployed at a depth of 30.5 meters, with ARGOS telemetry of position. |
| Click on figures for larger images.
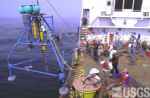
Figure 4A. Large bottom tripod frame being deployed from the U.S. Coast Guard Cutter Marcus Hanna at a site in Massachusetts Bay. |
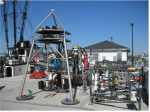
Figure 4B. Three types of bottom frames on the dock just prior to loading aboard ship for deployment as part of an experiment near Myrtle Beach, South Carolina. |
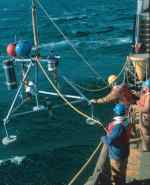
Figure 4C. A small tripod frame, about 1.5 meters high, being deployed at a site in Massachusetts Bay. |
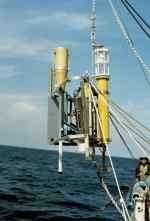
Figure 4D. Instrument package used in the Lydonia Canyon experiment, on the continental slope near Cape Cod, designed to obtain near-bottom observations in areas of rough topography. |
|
|