|
|
Each experiment has its own web page linked from the main index page on
the time-series database server. These experiment pages follow the same style and
include these common elements: Description, Duration, USGS PIs (Principal Investigators), Collaborators, Publications, Field Activity Reports, an interactive map, and Links to the Data. The first elements document the who, what, when, where and why of the experiment. The field activity reports are links to more details of how and what. The platform locations and selected metadata fields may be displayed using Google Earth, and clicking on the yellow icons.
The links to the data section are always at the bottom of an experiment page. The links on the left are organized into groups by sampling interval. Basic sampling interval means the rate at which the instrument made observations. Hourly-averaged and 6-hour low-passed files may also be available.
Using the Oceanographer Canyon Experiment page as an example, by selecting the "basic sampling interval" link (at lower left), a table of the file names and their contents similar to the one shown below is displayed to allow easier selection of the desired data. This catalogue is an important method of identifying whether the desired measurement is in any of the available files. In table 7, note that salinity data are available only in file 2492TCT-A.cdf, and that instrument was at 40.5029N, 68.1680W, deployed in 227 meters of water. In this table the file names are purple, indicating actual links in the database where the user may click on a blue file name to download the desired file.
table 7: Oceanographer Canyon Dynamics Experiment, Basic Sampling Interval
| File Name |
Start
Time |
End
Time |
Latitude |
Longitude |
Inst. Depth |
Water Depth |
Instrument Type |
Variables |
| 2481-AA.cdf |
01/27/82 |
03/20/82 |
40.5338 |
-68.2702 |
104.0 |
104.0 |
CM-208 T-0010 P-0688 NT-013 |
backscatter, current, pressure, temperature |
| 2481ATT-A.cdf |
01/27/82 |
03/20/82 |
40.5338 |
-68.2702 |
104.0 |
104.0 |
* |
attenuation |
| 2492-A.cdf |
01/28/82 |
07/09/82 |
40.5029 |
-68.1860 |
223.0 |
227.0 |
V-0335 T-0803 |
current, temperature |
| 2492ATT-A.cdf |
01/28/82 |
07/09/82 |
40.5029 |
-68.1860 |
0.0 |
227.0 |
* |
attenuation |
| 2492TCT-A.cdf |
01/28/82 |
07/09/82 |
40.5029 |
-68.1860 |
223.0 |
227.0 |
F-7335 C-0098 NT-105 |
attenuation, conductivity, salinity |
| 2501-AA.cdf |
01/28/82 |
07/09/82 |
40.4413 |
-68.1536 |
554.0 |
560.0 |
V-0628 T-0806 |
current, temperature |
| 2501TCT-A.cdf |
01/28/82 |
07/09/82 |
40.4413 |
-68.1536 |
554.0 |
560.0 |
* |
attenuation |
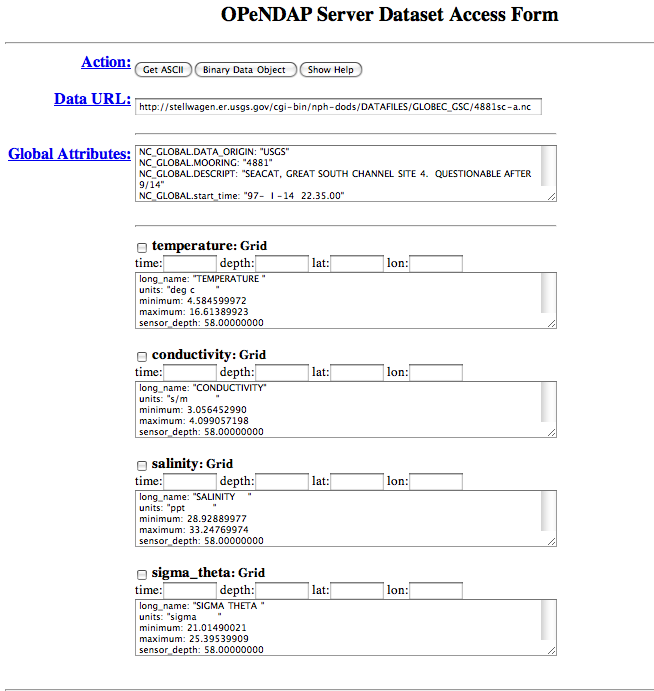
The data are also made available using the OPenDAP protocol (http://www.opendap.org), an open-source client/server architecture that allows users to access data from anywhere on the Internet. DAP (Data Access Protocol) employs lower level services such as http, ftp, and GridFTP in its implementation. OPenDAP was originally developed by Unidata, and evolved from an earlier protocol named DODS (Distributed Ocean Data System). Various clients are available to access the files, including loaddap for Matlab®, an IDL (Interactive Data Language) client, and the OPenDAP data connector (a Java application) for access. This is the real power of OPenDAP: that the data files do not need to be downloaded prior to use. By using a URL to this database in an OPenDAP-enabled application, the data may be accessed directly from the server.
In this database, the OPenDAP access is provided at the "data access via OPeNDAP" link at the bottom right of each experiment page. An example of how the global attributes, the variables, and a subset of their attributes are displayed using OPenDAP is shown below.
Figure 24: OPeNDAP display of 4881sc-a.nc, from the Oceanographer Canyon Dynamics Experiment
The files comprising the database are also listed in environmental directories or aggregators, such as the NASA Global Change Master Directory ( GCMD) or the Geospatial One-Stop. Listings in the national catalogues of environmental measurements enhances discoverability of the time-series data; thus enabling a potential user to search for "currents" and "Gulf of Maine" and find the appropriate links to this database. |