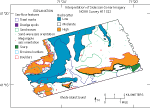
U.S. Geological Survey Open-File Report 2008-1181
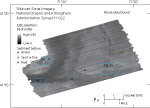
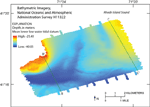
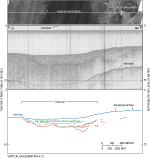
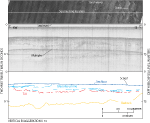
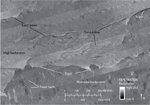
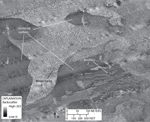
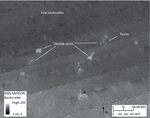
Sidescan-sonar imagery of the study area includes areas of low, moderate, and high backscatter. Bathymetric highs tend to have higher backscatter and bathymetric lows tend to have lower backscatter. Patterns apparent in the sidescan-sonar imagery include those interpreted to be sand waves, scarps, erosional outliers, boulders, trawl marks, and dredge spoils (figs. 2, 9). Areas of backscatter are often gradational, many patterns overlap, and boundaries are inferred. Low backscatter Areas of low backscatter, caused by weak acoustic returns, are the darker tones on the sidescan-sonar mosaic and indicate generally finer grained sediment. Low backscatter is located in deeper water, mainly in the north and west (fig. 9). These areas correspond to the channel system described above. Moderate backscatter Areas of moderate backscatter, characterized by moderate tones on the sidescan-sonar mosaic, are located between areas of low and high backscatter. Moderate backscatter covers most of the eastern and southern parts of the study area (figs. 9, 10). High backscatter Areas of high backscatter, caused by strong acoustic returns, are the lighter tones of the sidescan-sonar mosaic and indicate generally coarser grained sediment. High backscatter is found mostly in the shallower parts of the west and along the southern flanks of the eastern bathymetric high (figs. 9, 10). Sand waves Areas with tiger-striped backscatter tend to be located on bathymetric highs across much of the eastern half of the study area and in areas of the northwest and southwest. This pattern is interpreted to represent sand waves (figs. 2, 9). The sand waves on the eastern bathymetric high are oriented in different directions: in the north and along the southern edge, the crests tend to be oriented north-south, whereas in the central part they tend to be oriented east-west (fig. 10). Sand waves on the northwestern bathymetric high tend to have crests oriented roughly parallel to the sea-floor gradient, ranging from northeast-southwest to north-south. In general, north-south oriented sand waves have wavelengths of about 15 to 30 m; east-west-oriented sand waves have wavelengths of about 200 m. Megaripples, with wavelengths of about 1 to 3 m and crests oriented northwest-southeast, are also found on the northwestern high, indicating active sediment transport to the northeast or southwest (fig. 11). The southwestern areas of sand waves have north-south- and northwest-southeast-oriented crests. Sand-wave asymmetry could not be resolved in the sidescan-sonar or bathymetric data to determine sediment-transport directions. Scarps A continuous, curvilinear pattern of sharply contrasting backscatter is observed along the southern edge of the eastern bathymetric high (figs. 2, 9, 10). This pattern is also present on the southwestern high. These features occur in water depths ranging from 35 m in the east to 37 m in the west and tend to separate areas of higher backscatter from areas of lower backscatter. They are interpreted to be a series of small scarps, hills, and benches. Seismic-reflection data in the area of the scarps show a drop of about 1 m on the sea-floor surface (fig. 8). The bathymetric data show a channel along the northern side of the scarps and hills (fig. 6). Backscatter patterns similar to these are found east of the study area, where high-resolution (1-m) bathymetry shows small scarps, hills, and benches that correspond to the high and low backscatter variations (McMullen and others, 2007; 2008). Erosional outliers The northwestern bathymetric high shows areas of low backscatter surrounded by areas of high backscatter (figs. 2, 11). The high-backscatter areas are coarser grained and contain megaripples with wavelengths of 1 to 3 m. The low-backscatter areas are finer grained bathymetric highs with steep sides and flat tops, up to several hundred meters in diameter. Similar features in eastern Rhode Island Sound were interpreted to be erosional outliers (McMullen and others, 2007). Seismic-reflection data in this area show fluvial and estuarine sediments in the channel to the south that appear to continue northward along the flank of the bathymetric high where these small plateaus, approximately 1 m in height, are visible (fig. 7). Boulders High-backscatter targets with low-backscatter shadows are scattered throughout the study area. These features are interpreted to be boulders, probably glacial erratics, which are up to several meters wide (figs. 9, 11, 12). Trawl marks Thin, linear to curvilinear patterns of either high or low backscatter are seen in the deeper parts of the study area. These lines are interpreted to be trawl marks from fishing boats (fig. 10). Whether this area is a focus of commercial fishing or simply an area where the trawl marks are preserved is uncertain. Dredge spoils About a dozen round to oblong areas of high backscatter are observed in the southwest (fig. 12). These areas are about 20 to 50 m across and appear to be aligned along several lines. Many of the areas show distinctly higher backscatter than their surroundings. Other areas show only slightly higher backscatter than the surrounding sea floor, but appear to contain rocks. A disposal site for dredged material, Site 69b, is located to the south of the study area (U.S. Environmental Protection Agency, 2004). The high-backscatter areas are probably dredge spoils that fell as disposal trails during transport; similar features consisting of areas 12 to 35 m wide and 6 to 18 cm thick, have been reported outside the disposal site (U.S. Army Corps of Engineers, 2004). |